Provide observability metrics, kernel events, tracing, and profiling for containers, physical machines, and controllers.

Kernel Packet Drop Tracing with eBPF Dropwatch
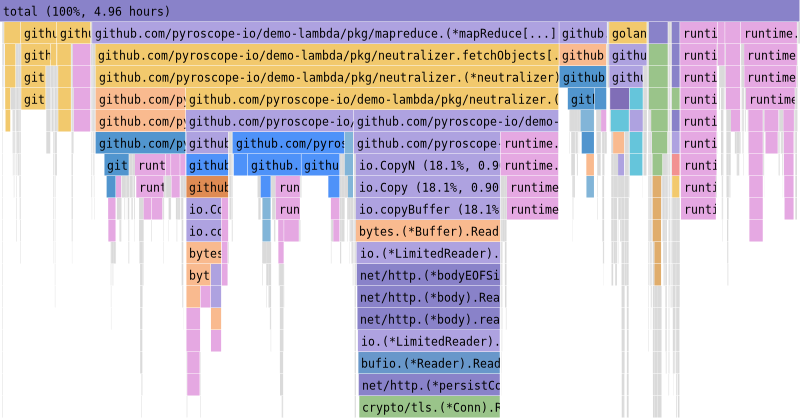
This article describes how HUATUO uses eBPF to implement full-stack packet drop observability across …