
Block Device I/O Latency
In cloud native environments, when business response times increase, how can you quickly determine whether the bottleneck lies in compute or storage? If it is a storage issue, how can you precisely identify which container, which disk, or even which I/O phase is causing the delay? The block storage I/O latency detection feature provided by HUATUO addresses these problems. Built on eBPF technology, it enables fine-grained, low-overhead observation of Linux block device I/O latency.
Features and Scenarios
It reveals not only the presence of slowness, but also why it occurs.
Instead of collecting traditional average wait times such as those from iostat, this feature delves into the I/O lifecycle, provides histogram-based latency distribution, and supports aggregation by container and disk dimensions.
It exposes the following core metrics:
| Metric | Description | Practical Value |
|---|---|---|
blkdisk_q2c |
Total latency from I/O entering the queue to completion | Reflects the complete I/O wait time perceived by the application |
blkdisk_d2c |
Hardware latency from I/O dispatch to completion | Directly indicates the real service capability of the disk device |
blkdisk_freeze |
Number of times the disk entered a frozen state due to I/O errors or similar | Provides early warning of storage hardware degradation or failure |
These three metrics form a foundation for I/O performance analysis and are particularly valuable in the following scenarios:
-
Scenario 1: Identifying noisy containers
When an application on a host becomes slow, examining the
blkdisk_q2clatency distribution per container can immediately reveal that a background batch processing container has abnormally high I/O latency, confirming that it is aggressively consuming disk bandwidth. -
Scenario 2: Distinguishing software queueing from hardware bottlenecks
If
blkdisk_q2clatency is high butblkdisk_d2clatency is normal, the problem is likely due to a long kernel I/O scheduler queue—meaning pressure is high but the disk itself is still capable. If both are high, the hardware device has reached its performance limit. -
Scenario 3: Storage hardware failure warning
Monitor the
blkdisk_freezemetric. When its value begins to increase, it often indicates bad sectors, link instability, or other disk issues. This serves as an early signal of hardware failure, allowing intervention before data loss occurs.
Usage Guide
HUATUO exposes the above metrics in Prometheus format. You can scrape them via curl localhost:19704/metrics. Combined with a Grafana dashboard, you can quickly build a storage performance monitoring view. Two typical usage methods are described below.
Quick diagnosis: Identifying high-latency containers
During container stress tests or when I/O contention is suspected, instead of examining trends first, directly check the I/O latency quantiles for all containers.
# Query the IO total latency (Q2C) bucket distribution across all disks for containers
curl -s localhost:19704/metrics | grep 'container_blkdisk_q2c'
Based on the returned labels (container_id, disk, zone), you can quickly identify which container is experiencing high latency on which disk. The zone label represents different latency ranges, giving you visibility into the latency distribution.
In-depth analysis: Correlating with disk hardware latency
Once a suspect container and disk are identified, the next step is to determine whether the problem stems from queueing or from the hardware itself.
# Query hardware latency (D2C) for a specific disk (e.g., sda)
curl -s localhost:19704/metrics | grep 'blkdisk_d2c{disk="8:0"}'
Compare the counts of blkdisk_q2c and blkdisk_d2c in the corresponding high-latency zone. If d2c also appears in high-latency buckets, it indicates that hardware response has slowed. If d2c is normal while q2c is high, optimization should focus on adjusting the I/O scheduler or the application’s own I/O patterns.
Linux Kernel Block I/O Path
To understand where these metrics originate, a clear understanding of the Linux kernel block I/O process is necessary. The following diagram simplifies the lifecycle of a single I/O request.
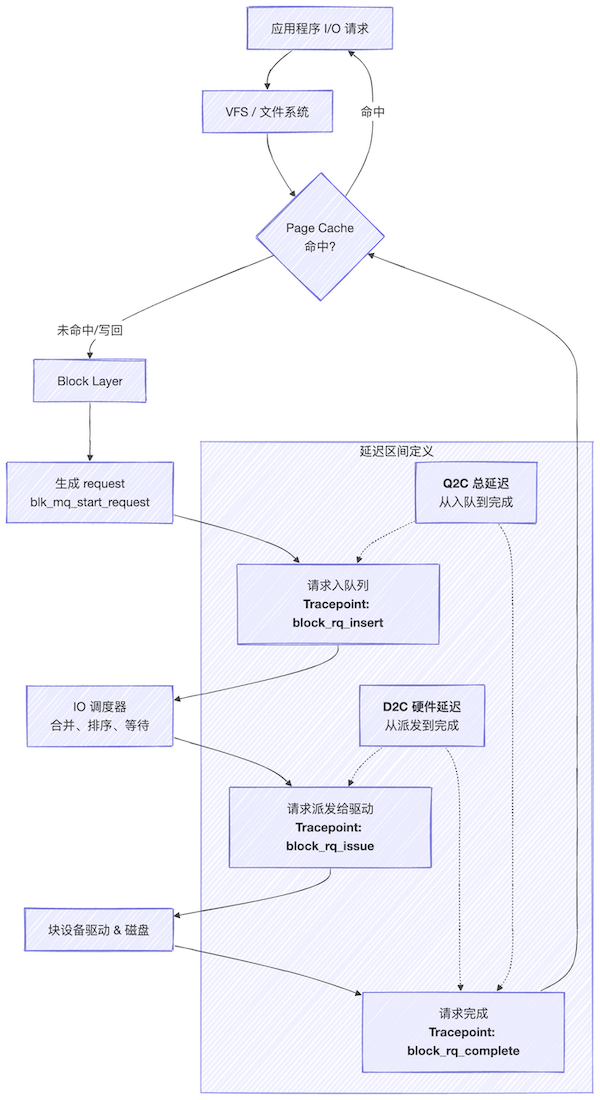
Key phase descriptions:
-
Q2C (Queue to Complete):
From the moment an I/O request is placed into the scheduling queue until it is marked as complete. This phase includes wait time in the queue and hardware processing time.
-
D2C (Dispatch to Complete):
From the moment the I/O request is dispatched by the scheduler to the underlying driver until final completion. It primarily reflects the processing latency of the hardware device itself.
-
Freeze:
When the disk controller encounters an I/O timeout or fatal error, the kernel freezes the request queue to prevent new I/O from being issued. This is a protective mechanism in response to anomalies.
HUATUO Implementation Mechanism
How does HUATUO efficiently capture these fine-grained metrics without modifying kernel code or restarting applications? It relies on a classic architecture design: in-kernel eBPF probes plus user-space data aggregation.

Key implementation details:
-
Precise kernel attachment points
The BPF programs of HUATUO (located in the
bpf/directory) are strategically attached to theblock:block_rq_issueandblock:block_rq_completeraw tracepoints. This bypasses the complex block layer multi-queue implementation and directly captures the two critical moments of I/O: dispatch and completion. -
Dual-dimension data aggregation
In
iolatency_tracing.go, two core structures are defined:BlkDiskEntryandBlkgqEntry. They correspond to data read from the BPF mapblkdisk_map(per disk) andblkcg_map(per cgroup), respectively. This indicates that the eBPF program performs differentiation and counting along these two dimensions within the kernel. -
Efficient container association
The
updateContainerBlkDiskmethod illustrates how the user-space agent dynamically maintains the mapping between containers and the cgroup (blkio subsystem). It periodically scans the local container list (every 20 seconds), writes new container information into the BPF map, and cleans up entries for destroyed containers. This allows subsequently collected cgroup-level latency data to be accurately tagged with container labels. -
Low-noise histogram output
The
fetchContainerIOlatencyandfetchBlkDiskIOlatencymethods iniolatency_collector.godump the data from the BPF maps, normalize it according to predefined latency ranges (Zones), and ultimately generate Gauge-type Prometheus metrics with azonelabel. This design keeps data volume manageable and query efficiency high.
Summary
The block storage I/O latency detection feature of HUATUO demonstrates the core advantages of eBPF in observability: kernel visibility, dynamic tracing, and minimal performance impact. It simplifies I/O problem diagnosis - which previously required numerous tools and complex experience - into a few clear metrics. Whether used for daily monitoring dashboards or emergency troubleshooting, it significantly improves efficiency.