

HUATUO Adds Moore Threads GPU Monitoring
Observability support for Moore Threads full-featured GPUs has been merged into HUATUO’s mainline. With PR #641, contributed by Moore Threads, operators and developers can monitor GPU status in HUATUO and correlate device and host data on a shared timeline to monitor and troubleshoot individual machines and clusters, without applying private patches.
The integration brings GPU device status, PCIe links, and MTLink GPU interconnects into a unified observability interface, providing data for routine AI cluster health checks, troubleshooting, and capacity planning.
Support Overview
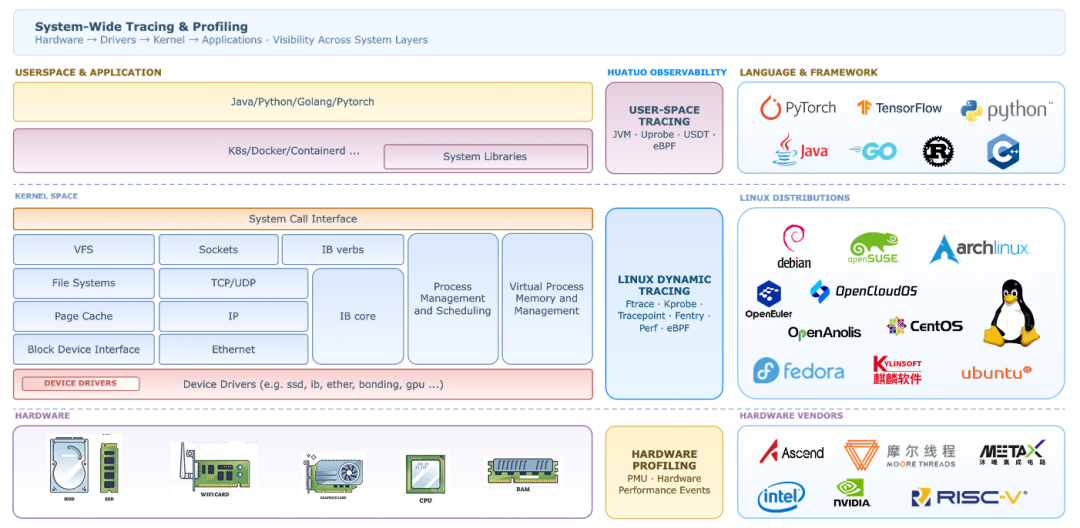
HUATUO is an operating-system-level observability project open sourced by Didi and incubated by the China Computer Federation (CCF). It uses eBPF and dynamic kernel tracing to provide deep visibility into cloud-native general-purpose computing, AI computing, and bare-metal infrastructure.
As AI accelerators developed in China enter large-scale deployment, GPU memory pressure, chip overheating, degraded PCIe links, and GPU interconnect faults become important concerns when troubleshooting training and inference workloads. Host logs, scheduling data, and network signals alone often cannot directly reveal device status. Running vendor CLIs individually and parsing their output also adds operational overhead in multi-GPU and cluster environments.
Moore Threads GPU support combines device signals with HUATUO’s existing host observability data, helping operators narrow down the source of an issue.
Operational Benefits
This feature collects GPU, PCIe, and MTLink metrics and correlates them with host data for routine monitoring and troubleshooting. Long-term trend analysis also supports capacity planning and health checks. The following table outlines common symptoms and investigation paths:
| Typical symptom | Correlated signals | Potential causes to investigate |
|---|---|---|
| Training throughput on one GPU suddenly drops without changes to the code, batch size, or learning rate | Core temperature, current and maximum clock frequencies, fan speed, current power draw, and power limit | Thermal throttling, fan problems, or power limits |
| Intermittent OOM errors or GPU memory allocation failures despite apparently sufficient memory | GPU memory temperature, used and total memory, and current and maximum memory clock frequencies | Abnormal memory temperature or frequency, considered alongside memory usage |
| Slower multi-GPU collective communication, such as all-reduce | Current and maximum PCIe link speed and width, replay count, and MTLink state | A downgraded PCIe link, link quality problems, or MTLink faults |
New Observability Capabilities
Native Collection and Unified Metrics
The mthreads_gpu collector uses the official Moore Threads MTML library to read GPU status, converts the data into standard Prometheus metrics, and exposes them through HUATUO’s native /metrics endpoint. No additional sidecar is required.
The collector frequently polls dynamic metrics and collects data from multiple GPUs in parallel. If the driver or underlying library encounters a transient error, it attempts to reconnect automatically according to its retry policy.
The initial integration covers the following data:
| Metric category | Monitoring scope | Key data |
|---|---|---|
| Basic information | Device identity and inventory | Model, serial number, PCI / BIOS information, and GPU memory specifications |
| Operating status | Health, workload, and GPU memory | GPU and memory temperatures, power draw, voltage, power limit, compute and memory utilization, and total and used memory |
| Operating status | Clock frequencies, cooling, and performance state | Current and maximum GPU and memory clock frequencies, fan speed in RPM and percent, and P-state |
| Operating status | VPU | Overall utilization, encoding and decoding utilization, and clock frequency |
| PCIe | Host-to-device links | Current and maximum link speed (GT/s), current and maximum link width (lanes), and replay count |
| MTLink | GPU interconnects within a node | Per-link state, per-link bandwidth, and link count |
Common Metrics
Metric names exposed by /metrics start with mthreads_gpu_. The table below follows the original article’s naming convention and omits this prefix:
| Metric name | Meaning and troubleshooting use |
|---|---|
gpu_temperature_celsius |
GPU core temperature; correlate with clock frequency and throughput changes to investigate cooling and throttling issues |
gpu_utilization_percent, memory_utilization_percent |
GPU compute and memory utilization; use to examine workload characteristics and whether data is being supplied fast enough |
memory_used_bytes, memory_total_bytes |
Used and total GPU memory; use to monitor memory pressure |
memory_temperature_celsius |
GPU memory temperature; correlate with capacity, clock frequency, and other signals when investigating anomalies |
pcie_link_speed_gt_per_sec, pcie_link_max_speed_gt_per_sec |
Current negotiated and maximum PCIe link speeds; compare them to check for link degradation |
pcie_replay_total |
PCIe replay count; sustained growth warrants investigation of link quality |
mtlink_state |
MTLink state, distinguished by the link label; 0, 1, and 2 represent DOWN, UP, and DOWNGRADE, respectively |
fan_rpm, fan_speed_percent |
Fan speed in RPM and percent, distinguished by the fan label; correlate with GPU temperature to assess cooling |
All metrics include a gpu=<index> label for filtering and aggregation by device in multi-GPU environments. These signals guide troubleshooting; confirming the cause requires workload context and other observability data.
Configuration and Deployment
Use a HUATUO version that includes this collector, and install the Moore Threads GPU driver and MTML shared library. Remove "mthreads_gpu" from the global BlackList, then enable health, PCIe, and MTLink metrics as needed:
|
|
On bare metal, run HUATUO directly. Docker / Kubernetes deployments require device nodes (/dev/dri/renderD*, /dev/mtgpu.*) to be exposed to the container and libmtml.so to be mounted. After starting HUATUO, metrics with the mthreads_gpu_ prefix are available at /metrics.
Future Plans
Metric collection is the first step in the collaboration between Moore Threads and HUATUO. The original article outlines the following areas for further development:
- Real-time anomaly reporting: Report temperature threshold crossings, stopped fans, PCIe link downgrades, and MTLink state changes as structured events to reduce alerting latency.
- Continuous profiling in production: Integrate the underlying profiling tools for lightweight performance analysis without restarting production services, with more detailed sampling available on demand.
- Cluster network topology observability: Integrate topology and performance data from MTLink interconnects within nodes and RDMA networks between nodes to observe GPU-to-GPU and cross-node communication.
- End-to-end AI job tracing: Correlate device metrics, higher-level AI frameworks such as PyTorch, and host scheduling context to extend tracing across training and inference jobs.
Conclusion
Through continued open source collaboration, Moore Threads and HUATUO plan to extend metric monitoring with anomaly events, profiling, and end-to-end tracing to help developers and operators manage AI infrastructure at scale.
Related Links
- Original WeChat article (Moore Threads Developers, in Chinese): Moore Threads Integrates with HUATUO for Full-Stack GPU Observability
- HUATUO GitHub: https://github.com/ccfos/huatuo