

Tracing Interrupt Spikes with irqtracing
Background
In production, we often encounter a difficult problem: several containers on the same host experience sudden service latency spikes at the same time. Historical monitoring shows that the host handled a large volume of interrupts during the incident, with sharp increases in cpu.irq and cpu.softirq utilization on multiple CPU cores. Monitoring can identify the affected cores, but it rarely preserves enough detail to reconstruct what was happening.
These incidents tend to be sporadic, lasting only tens of seconds or less. Because the interrupt spike affects only some CPU cores, changes in overall host load and individual container load may be too small to trigger the usual automatic diagnostic capture tools.
We developed irqtracing, a CLI tool, to capture evidence that can help investigate the root causes of these incidents.
Approach
We break the problem into three steps:
-
Detect abnormal system behavior promptly, recognizing signals such as a sudden increase in interrupt activity as soon as it occurs.
-
Capture runtime context during the incident, preserving evidence for root cause analysis while the anomaly is still present.
-
Present the evidence clearly, turning raw data into results that help developers narrow their investigation.
Detecting Interrupt Spikes
Our detection approach is straightforward: sample interrupt utilization on each CPU at fixed intervals, then apply rules to determine whether interrupt activity has spiked.
First, calculate the share of CPU time spent handling hardware and software interrupts between adjacent samples:
|
|
Based on observations from production, we use two detection rules. Their thresholds can be adjusted to suit the workload:
-
Simultaneous spikes across multiple CPUs: Flag an anomaly when several CPUs show a sharp increase in interrupt utilization at the same time.
-
Sustained high utilization on one CPU: Flag a CPU when its interrupt utilization remains high across multiple consecutive sampling windows.
The default thresholds are:
| Pattern | Detection rule | Capture target |
|---|---|---|
| Spike across multiple CPUs | At least 3 CPUs simultaneously increase by at least 20 percentage points, with at least 30% growth relative to the previous window | The CPU with the largest increase |
| Sustained high utilization on one CPU | One CPU reaches 80% utilization in 10 consecutive windows | The affected CPU |
Once these rules identify a target CPU, HuaTuo automatically triggers a capture on that CPU and collects the diagnostic data.
Capturing Runtime Context
HuaTuo already provides several tools for diagnosing interrupt problems. For example, checking whether the scheduler tick fires as expected can reveal whether interrupts have been disabled for too long and help identify why. That mechanism does not fit this case. Here, the problem is a burst of frequent interrupts rather than a prolonged period with interrupts disabled. Each interrupt takes very little time to execute, but repeated interruptions disrupt normal execution and affect system performance.
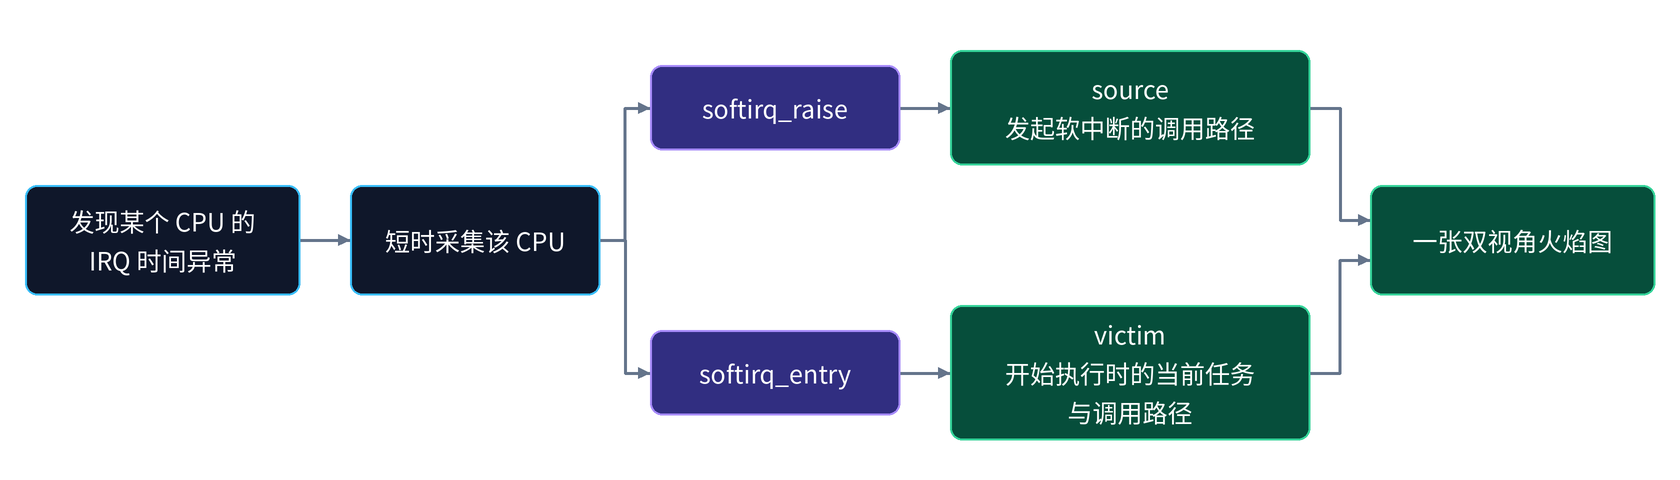
irqtracing aims to reveal where these interrupts come from, which tasks they affect, and what work they perform.
The approach relies on two tracepoints: irq:softirq_raise and irq:softirq_entry.
-
irq:softirq_raisecollects the call stacks that raise softirqs on the selected CPU, identifying their sources. These paths include raising a softirq after the immediate work of a hardware interrupt handler, as well as raising one directly from other kernel code. -
irq:softirq_entrycaptures the tasks present when softirq execution begins on the selected CPU, providing the victim view. Affected tasks can include kernel threads and user processes interrupted while running in either kernel mode or user mode.
Here are example call stacks for softirq_raise and softirq_entry:
softirq_raise:
|
|
softirq_entry:
|
|
The two call chains suggest the following sequence:
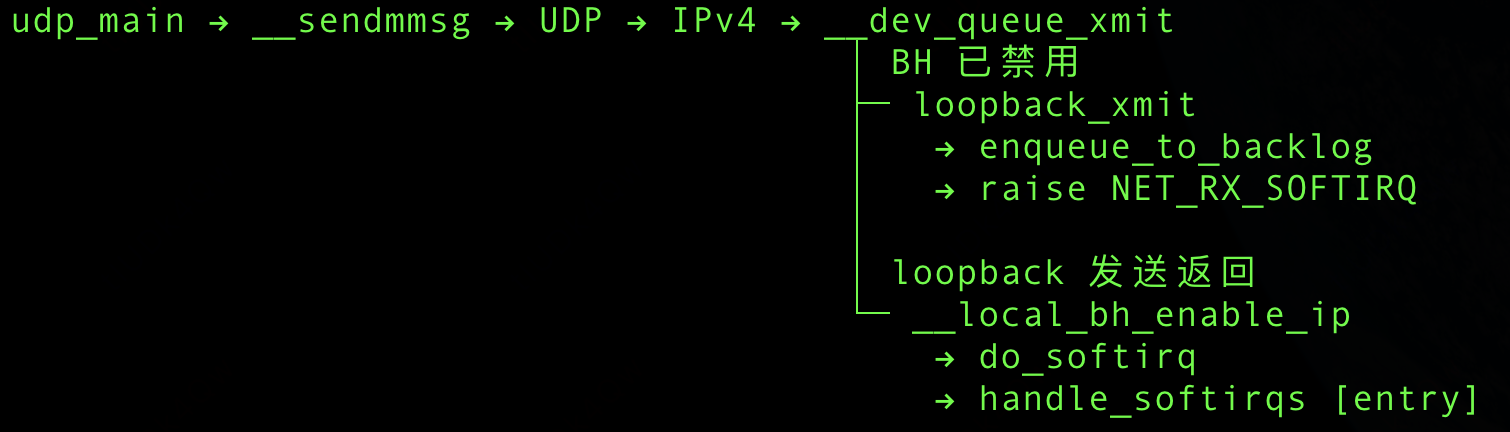
The same task raises a receive softirq inside sendmmsg() and then executes it inline after re-enabling bottom halves (BH). Both samples occur within the same send call made by PID 1663386.
In chronological order:
-
Raise identifies the source of the work: PID 1663386 sends UDP packets. The loopback path places the packets on the receive backlog and sets the current CPU’s
NET_RX_SOFTIRQpending bit. -
Entry marks the start of execution: When the same send path re-enables BH, it finds pending work and immediately begins processing softirqs. The CPU, PID, and user stack therefore remain the same; the system call has not yet returned.
-
Matching user stacks indicate the same calling context: Both samples show
udp_main→__sendmmsg. At entry, the current task is still the sending task, but execution is now in interrupt context.
These stacks do not establish that PID 1663386 is the UDP receiver. It happens to be the task in whose context softirq processing begins.
Together, these two tracepoints let us reconstruct much of the activity behind interrupt load and distinguish its sources (source) from the tasks present when softirqs execute (victim).
There is still a practical problem. A call stack can describe an individual event clearly, but we are dealing with a burst of many interrupts in a short period. One stack may be representative and even point toward the root cause, yet a handful of samples cannot characterize everything that happened. Collecting more samples creates another challenge familiar to anyone who has debugged production systems: a terminal flooded with stack traces. Extracting useful clues from that volume of output takes effort, even with AI assistance.
To capture enough evidence, reduce misleading conclusions from sparse samples, and make the result easy to read, we use a flame graph. During a short capture window, we collect as many interrupt events as possible, then aggregate their call stacks into two views, source and victim, within a single flame graph.
Here is an example:
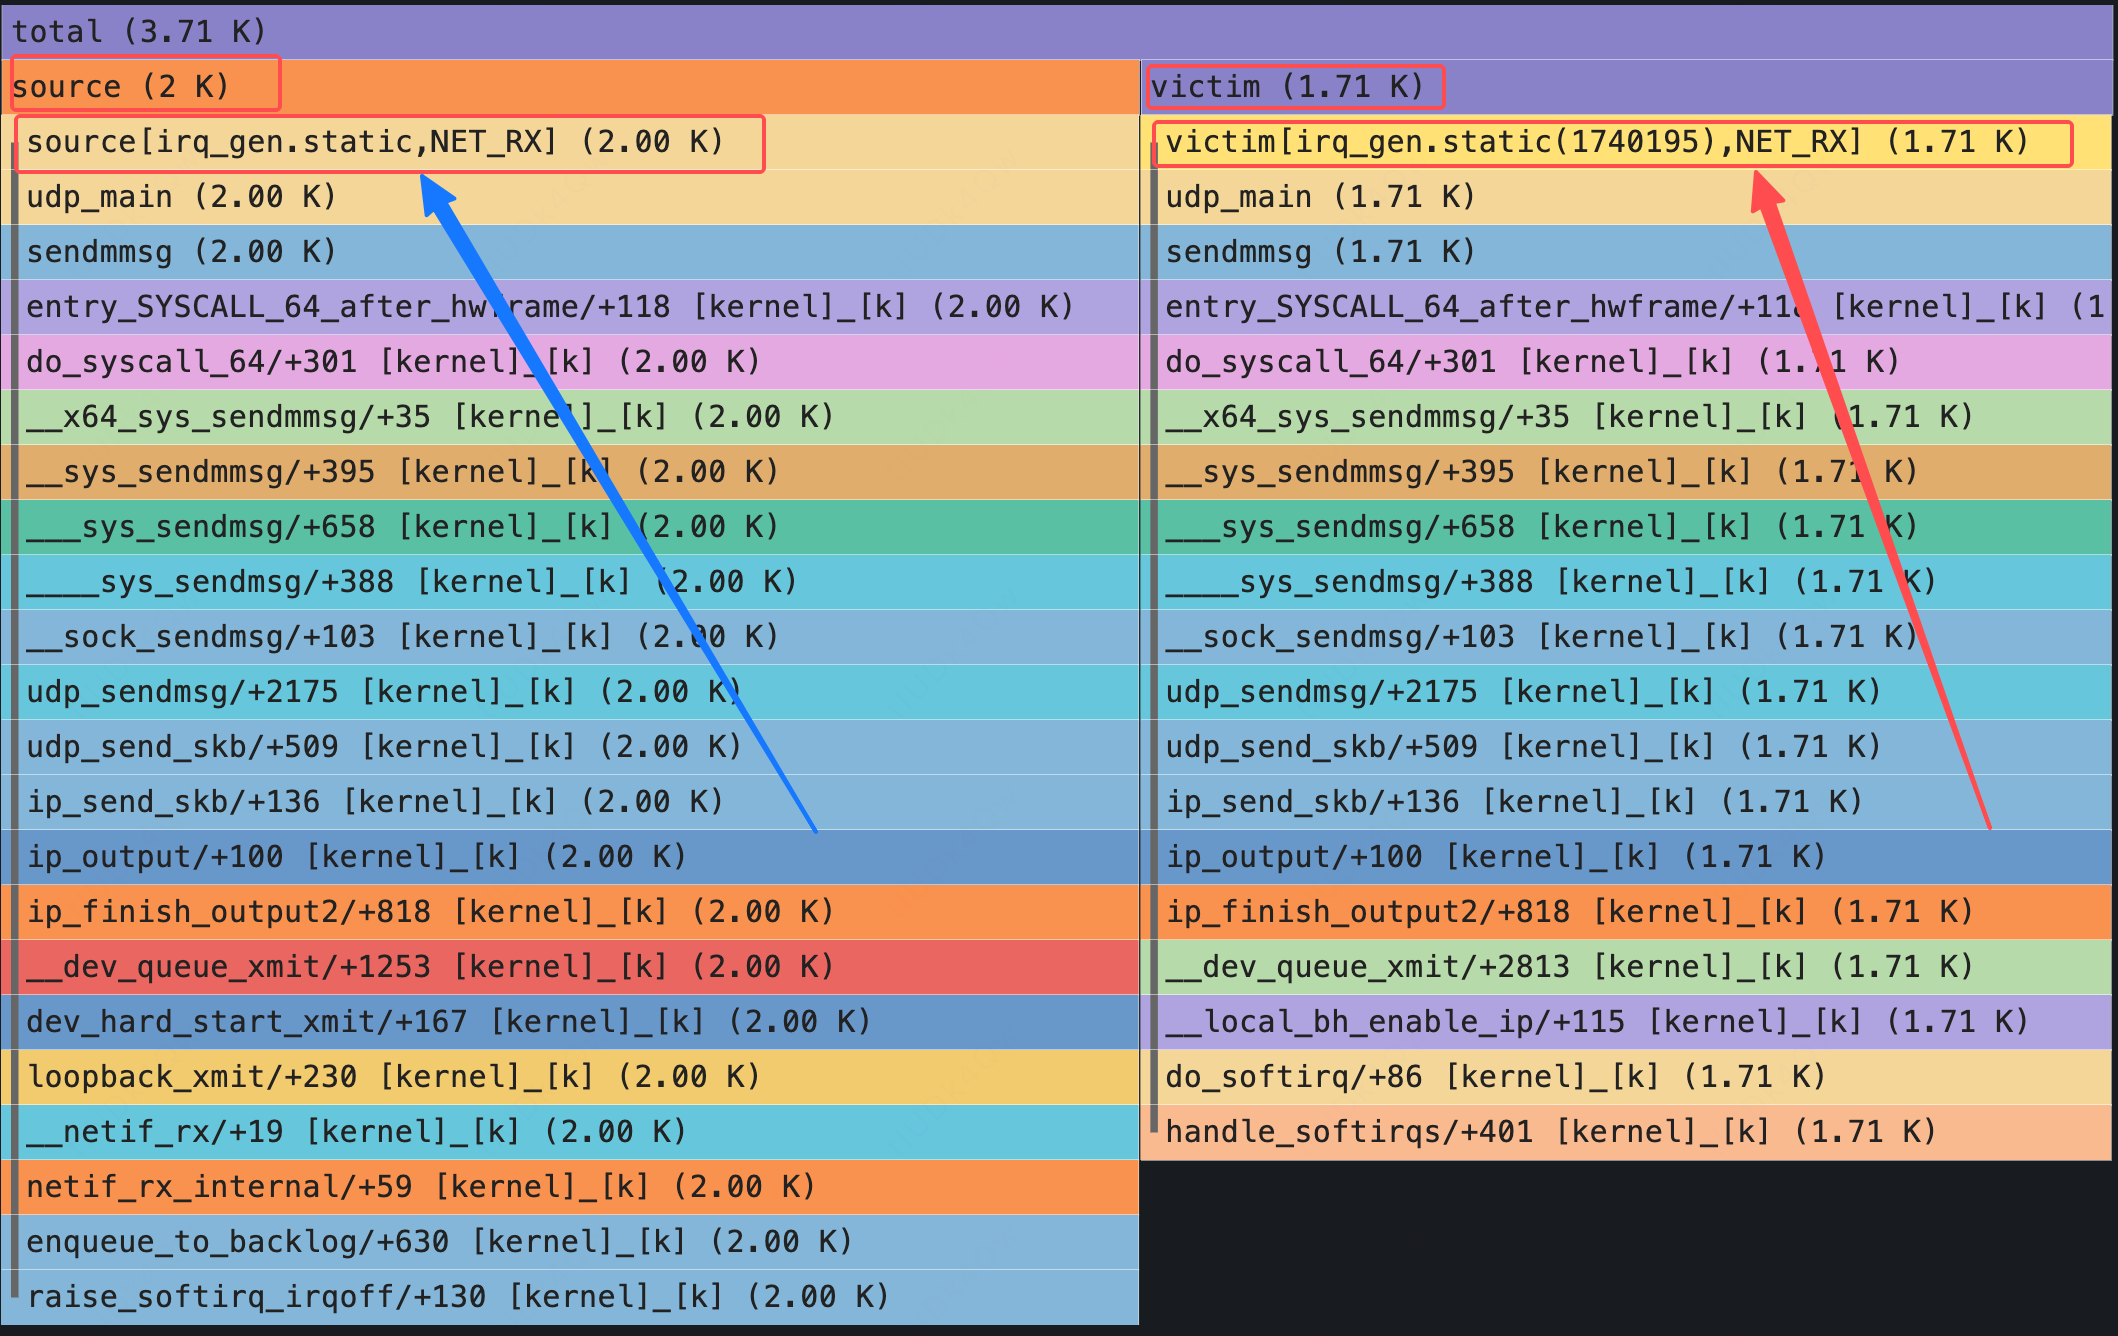
In this example:
-
A total of 3,709 captured stack traces are aggregated.
-
The
sourceside shows 2,000 occurrences of the same call stack raisingNET_RXsoftirqs. -
The
victimside records 1,706NET_RXsoftirq entry events with the same process, PID 1740795, as the current task. -
Two
RCUsoftirq events also occur while that process is running. Their bars are so narrow that they are difficult to see beside the much largerNET_RXcount.
This view supports several common investigation needs:
First, it turns individual stack traces into a distribution of activity. A call path that appears repeatedly occupies a wider region. Investigators can start with the dominant softirq type and then inspect its call chains, rather than reading every stack trace separately.
Second, source and victim each have their own root in the same result. If the source side is dominated by a particular interrupt type, such as NET_RX, while a business process appears frequently on the victim side, that suggests a concrete question to investigate: is network softirq activity competing with that process for CPU time? Both views retain softirq types and task labels, making it possible to narrow the investigation from event categories to specific call paths and tasks.
Third, it preserves the distinction between the task that raises a softirq and the task present when it executes. Merging every stack into one tree, as in a conventional flame graph, can draw attention only to the widest functions. Separate views expose both where softirqs are frequently raised and which tasks are often on the CPU when those softirqs execute.
This is an aggregate view for finding investigative leads. It cannot establish that a particular source event interrupted a particular victim. Bar width represents event counts and must not be interpreted as elapsed time.
Trying irqtracing
Combining detection and capture, irqtracing works with HuaTuo as follows:
-
Apply the detection rules to identify an anomaly and select a target CPU.
-
Invoke the irqtracing CLI to capture interrupt activity.
-
In automatic tracing mode, let HuaTuo save the CLI’s capture results.
-
Alternatively, run the irqtracing CLI independently to produce a flame graph directly.
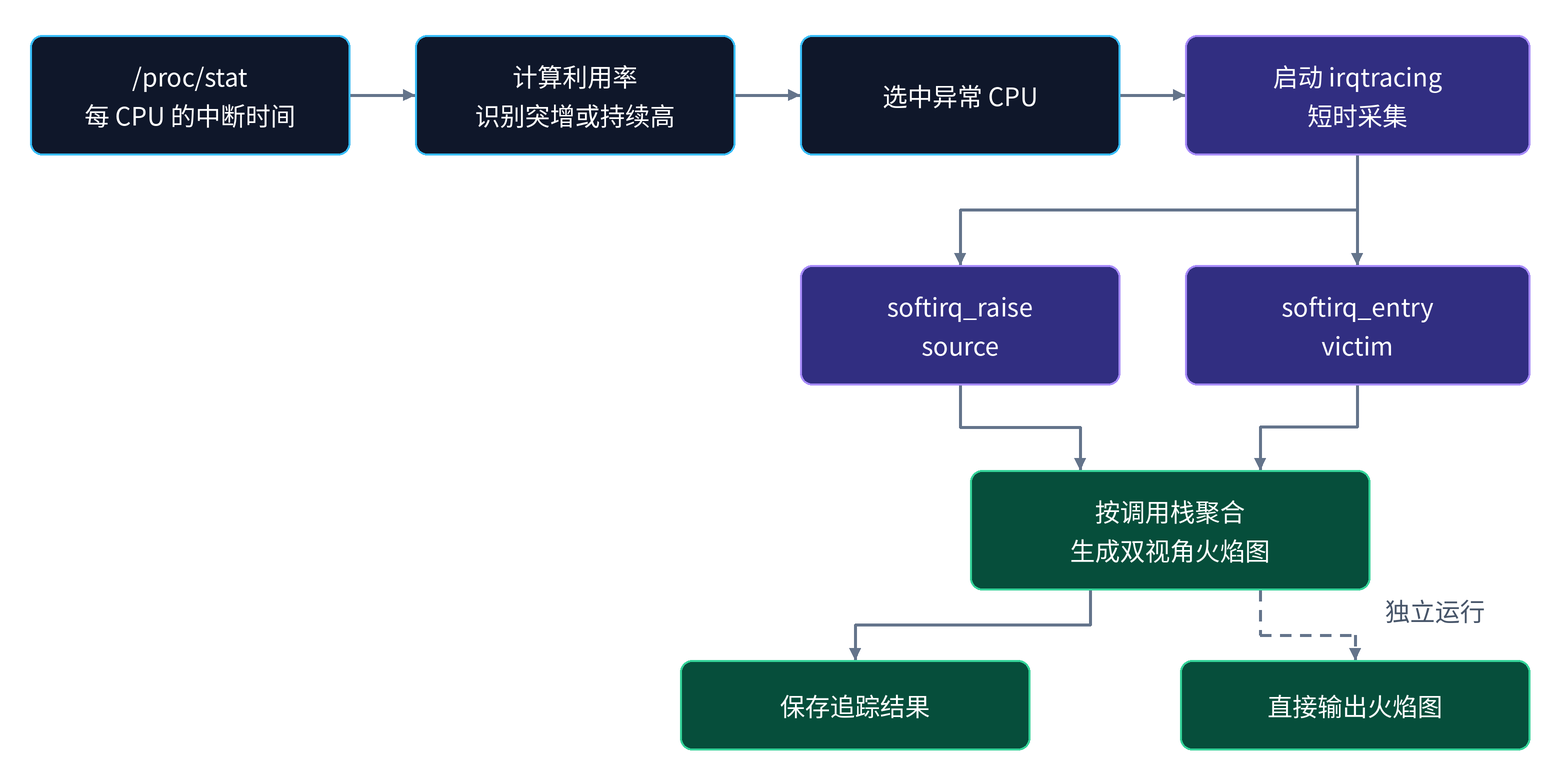
To run a capture manually, build the project, select a CPU, and write the result as an SVG flame graph:
|
|
The current approach has limitations. The rules for deciding whether IRQ utilization constitutes a spike are empirical and leave room for better detection methods. A more rigorous algorithm could improve capture accuracy and could also apply to similar metrics, such as cpuidle and cpusys. Softirqs can also execute in thread context, where their impact on other tasks is primarily scheduling delay. We have not included analysis of that case in the tool’s scope, because doing so would add substantial complexity for limited benefit.
irqtracing is a step toward understanding these incidents and preserving useful evidence for production debugging. We welcome users to try it and suggest improvements.