

Out-of-Process Go Heap Profiling with HUATUO
Abstract
When an application does not expose a heap profile endpoint, process-level memory metrics cannot attribute memory use to Go allocation stack traces. This article examines the Go runtime’s heap sampling model, profile bucket layout, and publication of statistics across GC cycles. It then explains how Huatuo locates the runtime data from outside the process, reads published active counters and allocation stacks, scales the samples, and produces a snapshot of in-use heap allocation hotspots. The method reuses existing runtime statistics. It requires sampling to be enabled, published statistics to exist, a supported runtime layout, and permission to read process memory; it does not require an HTTP export endpoint.
Keywords: Go; heap sampling; pprof; out-of-process collection; sample scaling; Huatuo
1. Introduction
Process RSS and container memory usage reveal memory pressure, but these totals do not identify the Go allocation stacks responsible for it. A Go heap profile groups statistics by allocation site. Collecting one conventionally requires an HTTP endpoint or an application call that writes the profile to a file. When neither is available, runtime sampling statistics may still exist and can potentially be read from outside the process.
The question is how to obtain heap statistics grouped by allocation stack without invoking a profile export function in the target process, and how to define what those statistics mean. Here, a heap snapshot means runtime sampling statistics read and aggregated during a collection window. It does not contain individual object addresses, type fields, or an object reference graph, and collection is not assumed to be atomic.
The analysis follows Huatuo’s Go provider. It covers the relevant 64-bit layouts at the listed Go 1.18–1.26 version tags, along with Huatuo’s variable lookup, batched reads, in-use estimation, and symbolization. The aim is to connect sampled objects, cycle counters, and output metrics; explain external collection and version compatibility; and identify the effects of sampling, publication timing, and concurrent reads. The analysis is based on source code and the sampling model.
2. Background and Related Work
2.1 How pprof Represents Heap Statistics
A Go heap profile groups object counts and byte counts by allocation stack trace. It supports analysis of both cumulative allocations and in-use memory. For an application exposing the pprof HTTP endpoint, the following commands collect a profile and display in-use bytes and objects:
|
|
Besides the HTTP endpoint, an application can call runtime/pprof.WriteHeapProfile to write a heap profile to a file. Both export paths use the same kind of runtime statistics.
The following illustrative -inuse_space output shows the meaning of the columns:
|
|
top aggregates values by function. flat is the sample weight attributed directly to a function; cum includes the weight attributed to that function and its callees. In this example, Handle makes no direct allocations, while the two downstream paths account for 96 MB, giving it flat=0 and cum=96 MB. Cumulative values can overlap across rows and must not be summed to estimate the total. sum% is the running sum of flat%. pprof documentation
Figure 1: Allocation call paths and pprof attribution.
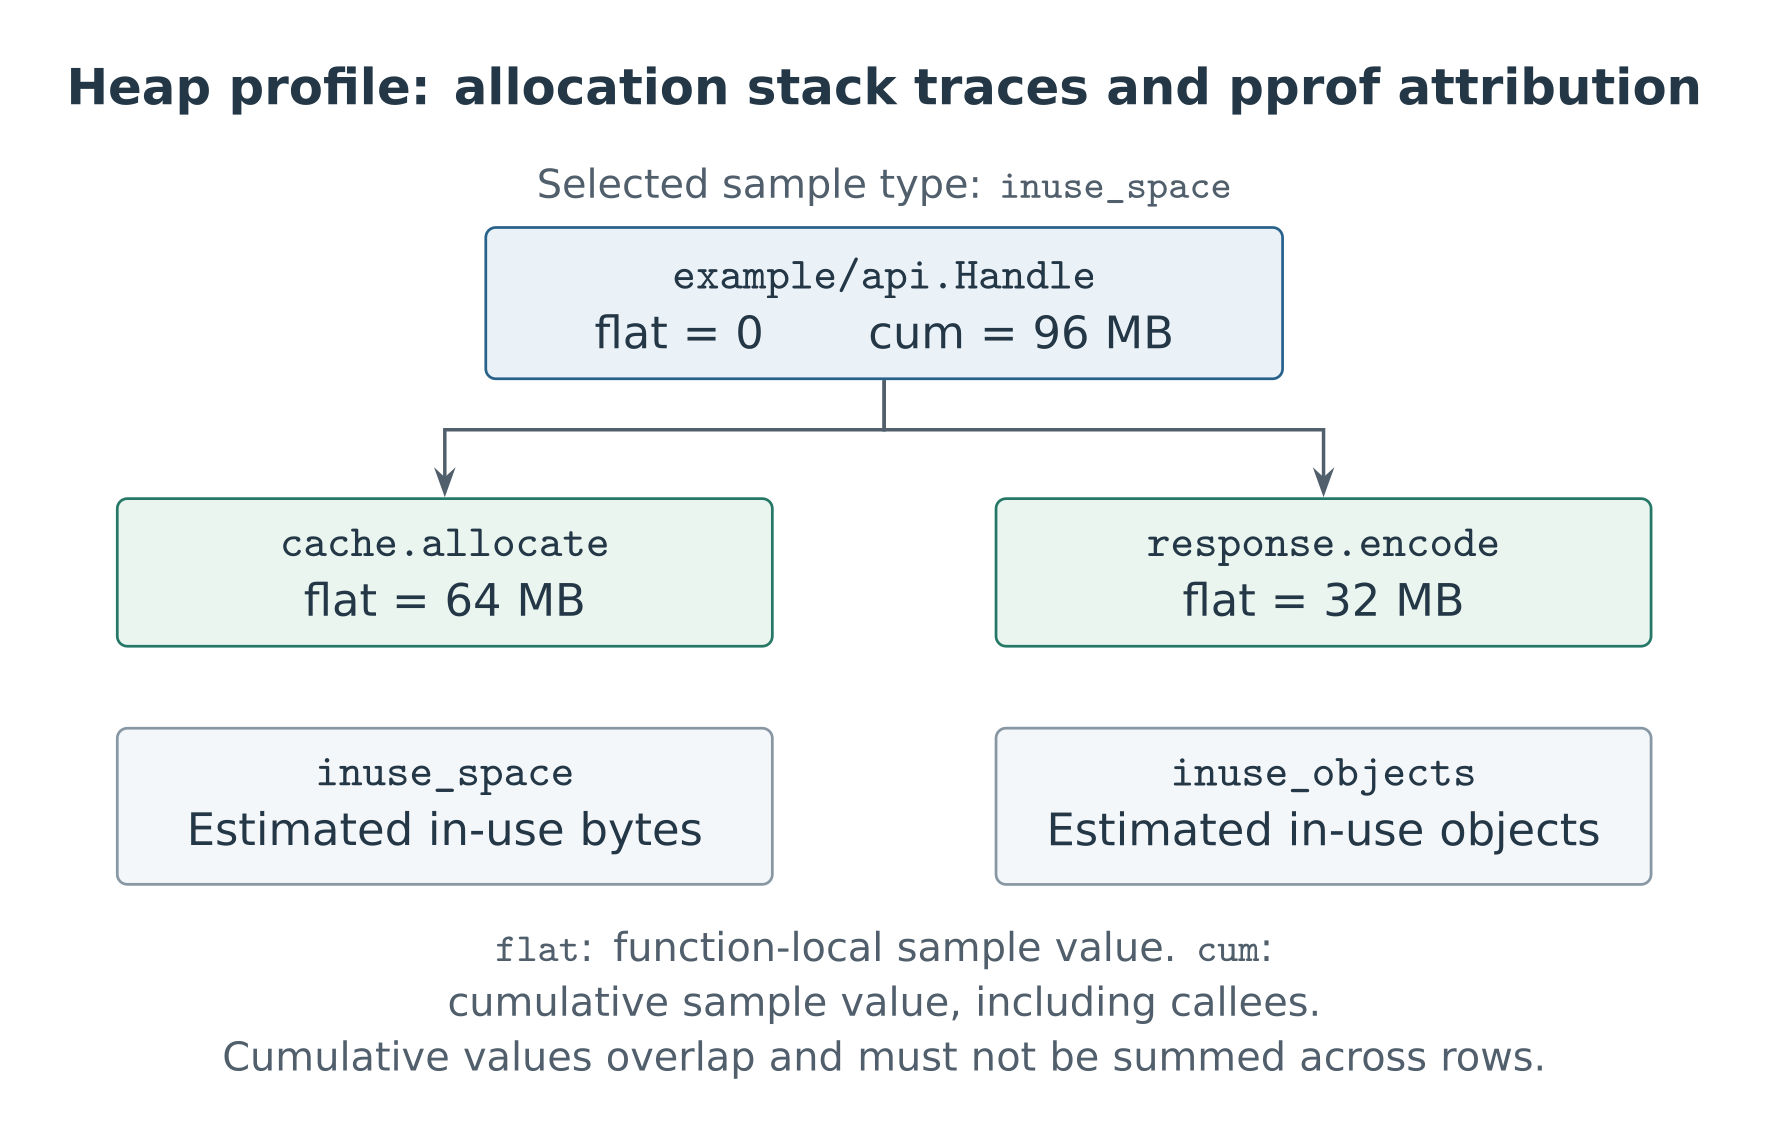
pprof attributes memory to allocation sites. It does not expose individual object addresses, types, fields, or reference relationships. Call graphs and flame graphs visualize the selected sample type, not the arrangement of objects in the heap.
Table 1: pprof sample types, meanings, and uses.
| Sample type | Meaning | Use |
|---|---|---|
alloc_objects |
Cumulative allocated objects, including objects already freed | Compare allocation counts between two points in time |
alloc_space |
Cumulative allocated bytes, including memory already freed | Find allocation hotspots for temporary objects |
inuse_objects |
Objects whose frees have not been accounted for | Find allocation sites retaining many objects |
inuse_space |
Bytes whose frees have not been accounted for | Find the main contributors to heap memory use |
2.2 The Data Available to an External Collector
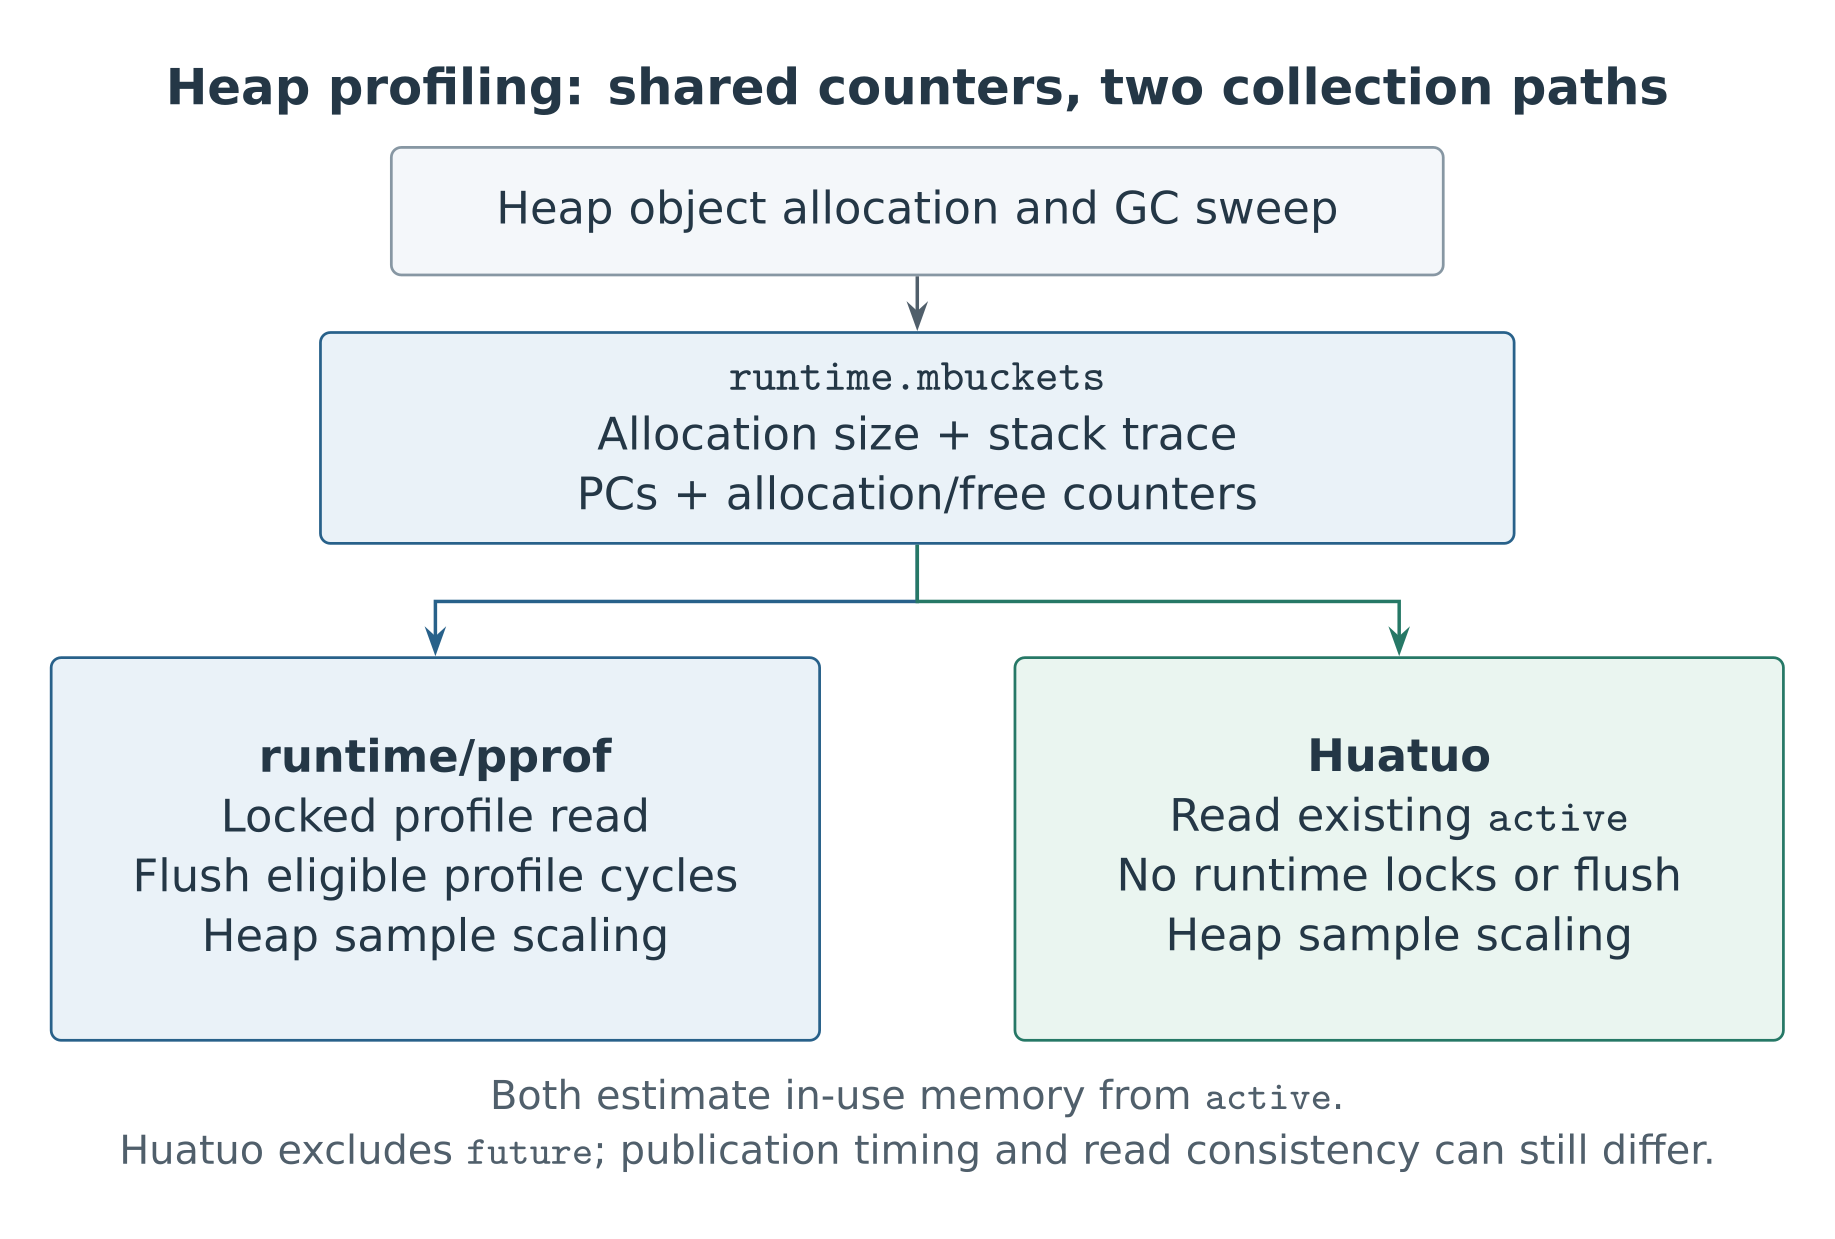
Go heap profiles use a linked list of statistics rooted at runtime.mbuckets; export does not require scanning every application heap object. Collection can therefore be framed as locating, reading, and interpreting these statistics from outside a process, provided sampling is enabled, the runtime layout is recognized, and read permissions are available. Huatuo currently estimates in-use memory from published active counters only. Pending events in future do not enter the calculation.
Figure 2: pprof and Huatuo use the same runtime statistics.
3. Go’s Heap Sampling Model
3.1 Linking Sampled Allocations to Frees
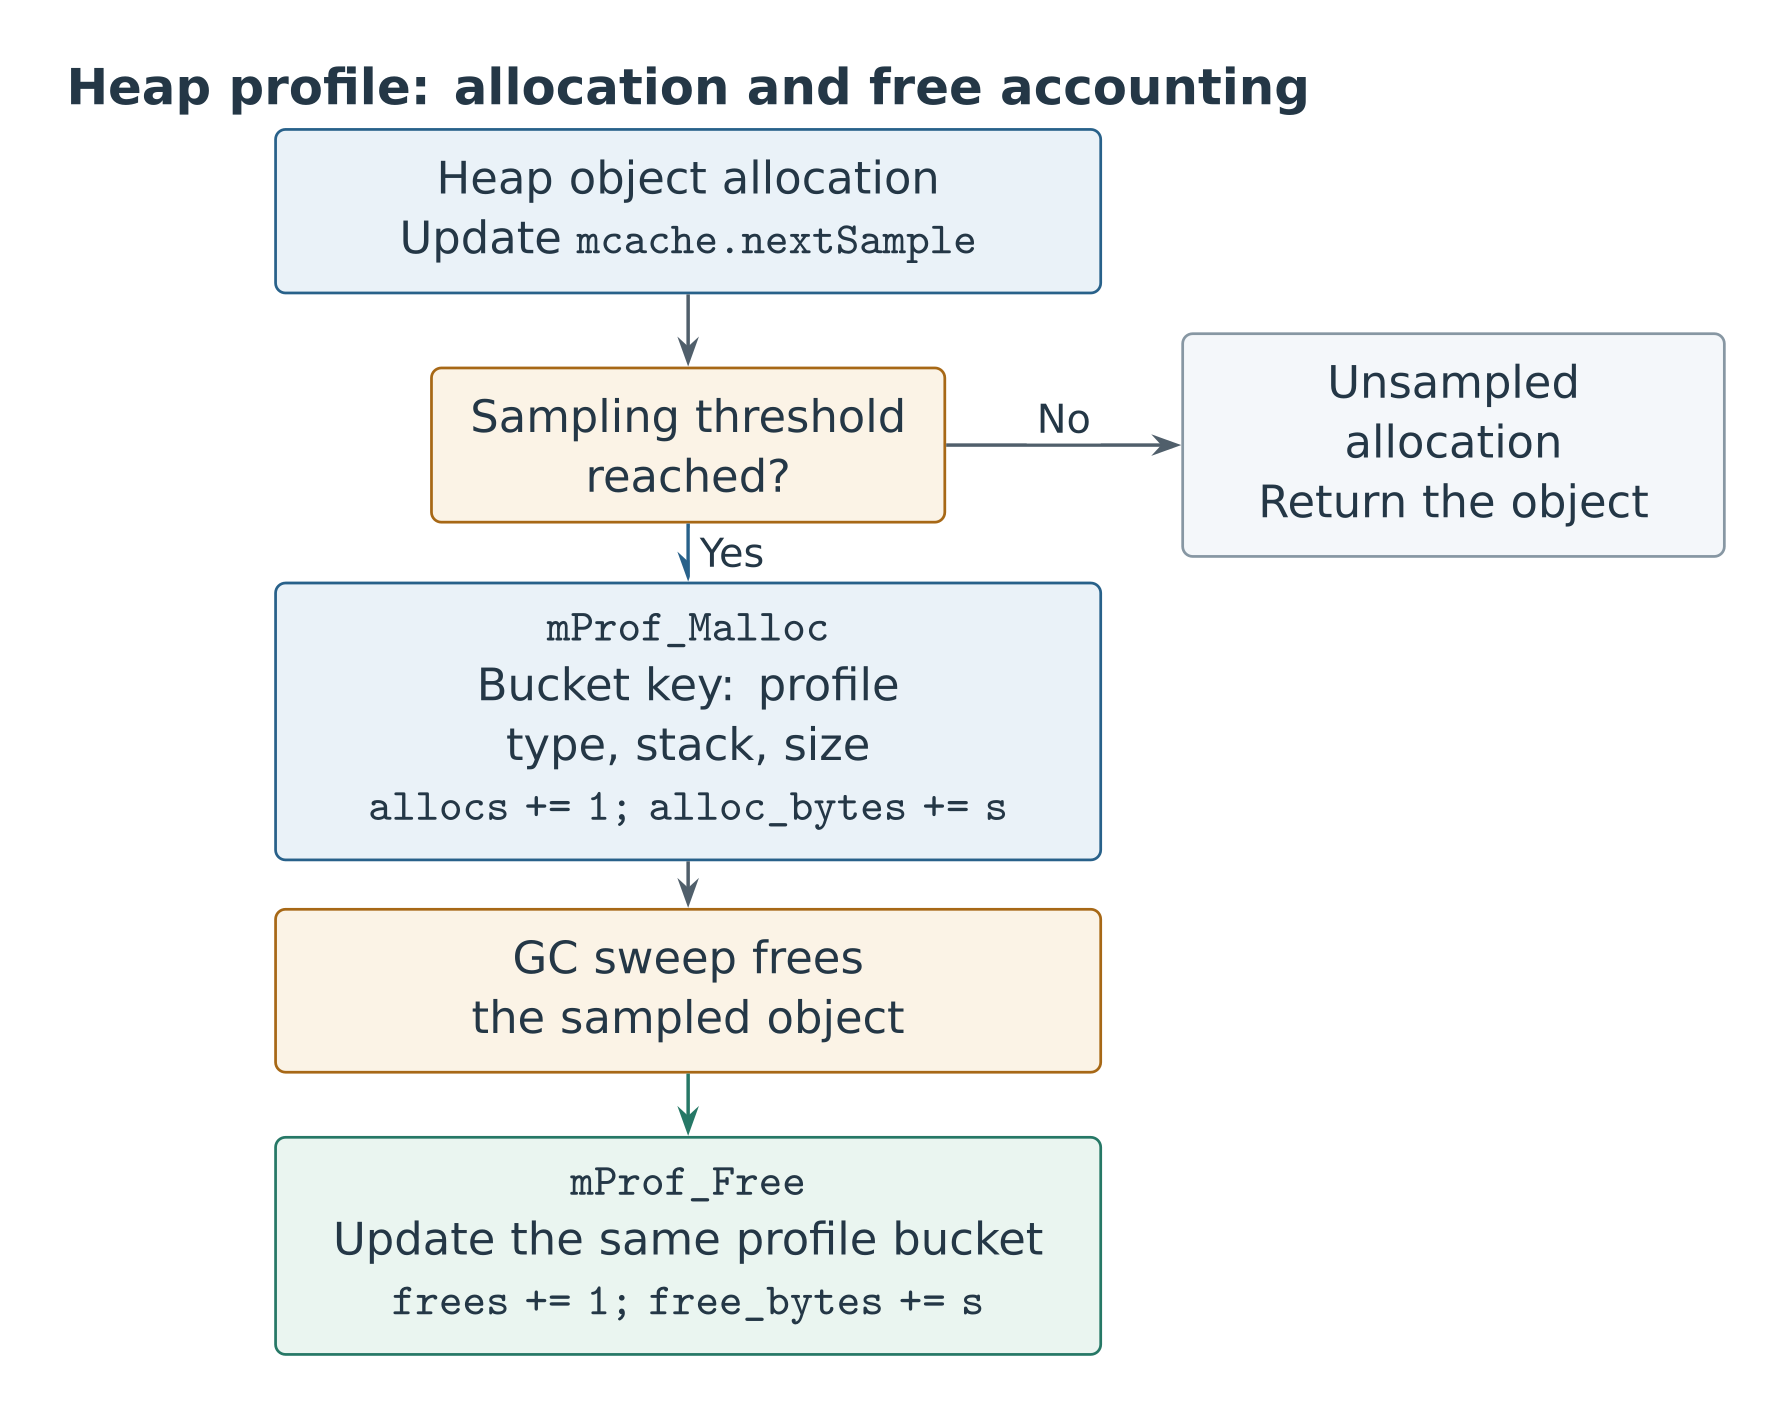
Memory sampling operates on the runtime’s heap allocation blocks. When an allocation is sampled, the runtime captures its allocation stack trace and records its allocation count and byte count in the corresponding bucket. When sweeping reclaims the object, the runtime updates that bucket’s free counters.
Figure 3: Accounting for a sampled object from allocation to free.
3.2 Sampling Probability and Estimation
Let R=runtime.MemProfileRate, measured in bytes. The runtime generates exponentially distributed sampling intervals, reaching a sampling point after roughly R allocated bytes on average. mcache.nextSample holds the remaining interval and is reset when a sampling point is reached. Snapshot collection does not resample existing objects.
R=0disables sampling.R=1records every allocation block.- For
R>1, shorter intervals generally yield more samples and increase the cost of stack capture and accounting.
For R>1, let s be the allocation block size in bytes. p(s) is the probability that the block is sampled, and exp(x)=e^x. In the Poisson sampling model over cumulative allocated bytes, the probability that an interval of length s contains no sampling point is exp(-s/R). The probability of at least one sampling point is therefore:
|
|
Figure 4: Sampling probability and the small-allocation approximation.
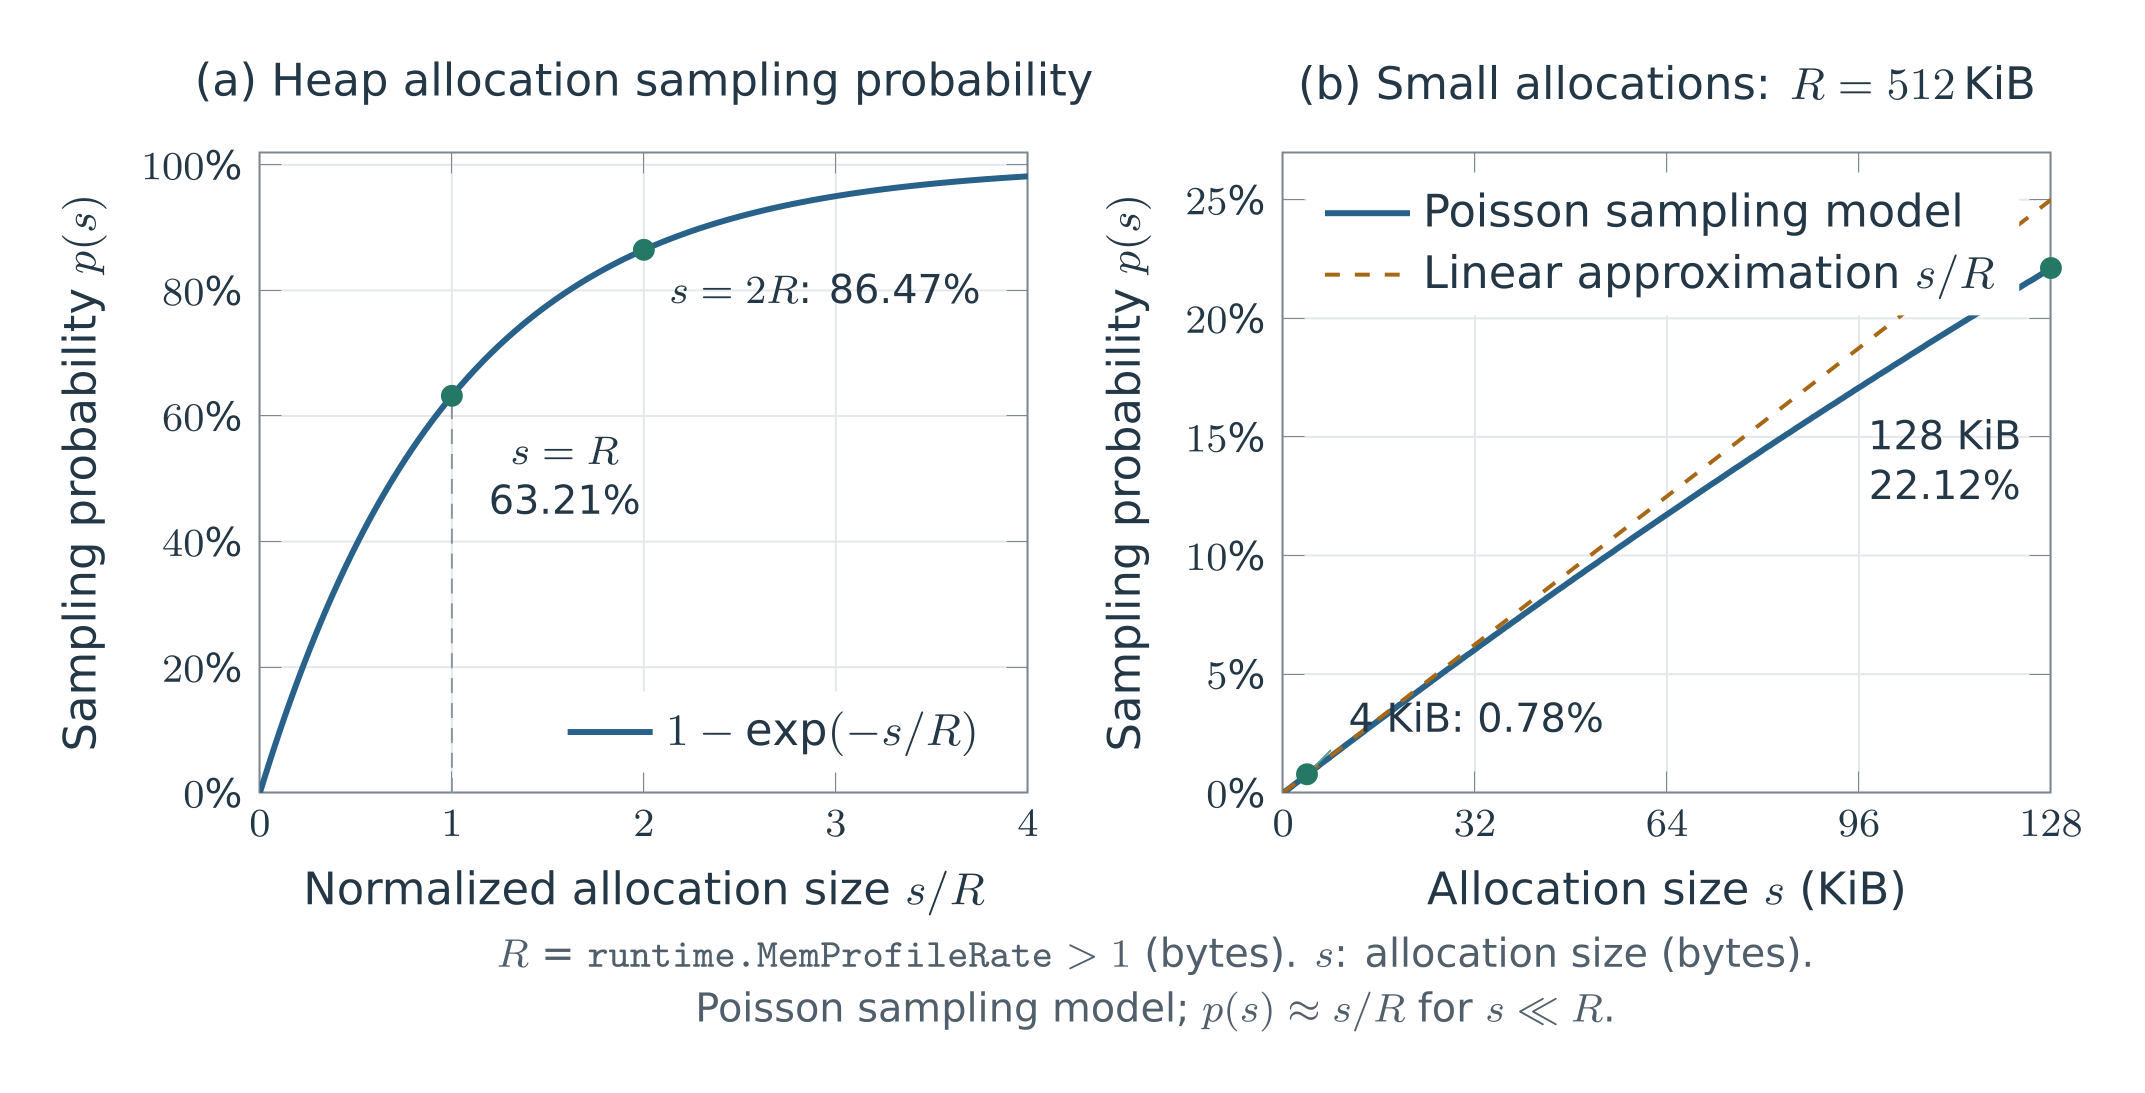
The left plot uses s/R on the horizontal axis. Because R is the mean of a random interval, an allocation of size s=R has a sampling probability of about 63.21%, rather than 100%. The probability approaches 100% as allocation size increases. The right plot fixes R=512 KiB and compares the exponential model with the linear approximation s/R. The two agree closely only when s is much smaller than R. These are model curves, not experimental measurements.
For example, with R=512 KiB:
Table 2: Sampling probabilities and scaling weights at different allocation sizes.
| Allocation block size | Sampling probability | Scaling weight |
|---|---|---|
| 4 KiB | About 0.78% | About 128.50 |
| 128 KiB | About 22.12% | About 4.52 |
| 512 KiB | About 63.21% | About 1.58 |
| 1 MiB | About 86.47% | About 1.16 |
For equal-sized allocations, let N be the actual allocation count and n the sampled count. The model gives E[n]=N·p(s), with the estimator N̂=n/p(s). Each sampled 4 KiB allocation thus receives a weight of about 128.50. The estimate remains subject to random variation, with greater uncertainty when samples are sparse. Recording all allocations at R=1 requires no scaling; the formula does not apply when sampling is disabled at R=0.
Because sampling probability varies with allocation size, samples must be scaled separately by size. Huatuo also needs the target process’s actual sampling rate. Section 3.3 describes how the effective rate is determined, and Section 5.1 discusses the effect of changes to that rate over time. nextSample, scaleHeapSample
3.3 Enabling Sampling and Resolving Configuration Overrides
runtime.MemProfile reads statistics. Whether sampling continues depends on the effective runtime value of MemProfileRate. The configuration precedence below follows the Go 1.26 documentation and source.
Table 3: Configuration and linking conditions that affect heap sampling in Go 1.26.
| Factor | Effect on sampling |
|---|---|
| Initial source value | The initial value is 512 * 1024, but startup can override it. It does not guarantee that sampling is enabled in every program. Variable definition |
Startup GODEBUG |
memprofilerate=N sets the rate; 0 disables sampling. The runtime or application can subsequently override it. Parsing logic |
| Reachability of the profile reader | If runtime.memProfileInternal is unreachable and the linking-mode condition is met, the linker sets disableMemoryProfiling, causing runtime startup to clear the rate. Reachability is a build-time property of references; the reader need not have executed. Linker logic |
| Go linking mode | Automatic disablement requires !DynlinkingGo(). Go shared builds, -linkshared, plugins, and related modes affect this condition. Using cgo or dynamically linking libc alone does not determine the outcome. Mode check |
| Application or library assignment | Assigning a positive value in init(), main(), or elsewhere enables sampling; assigning 0 disables it. An assignment can also re-enable sampling after startup cleared the rate. Set it once, as early as possible, and keep it stable. Usage contract |
| Test flags | go test -memprofilerate=N sets the rate before tests start. In Go 1.26, it assigns a value only when N>0; N=0 leaves the current value unchanged. testing implementation |
Figure 5: Sampling-rate overrides and the final enablement condition in Go 1.26.
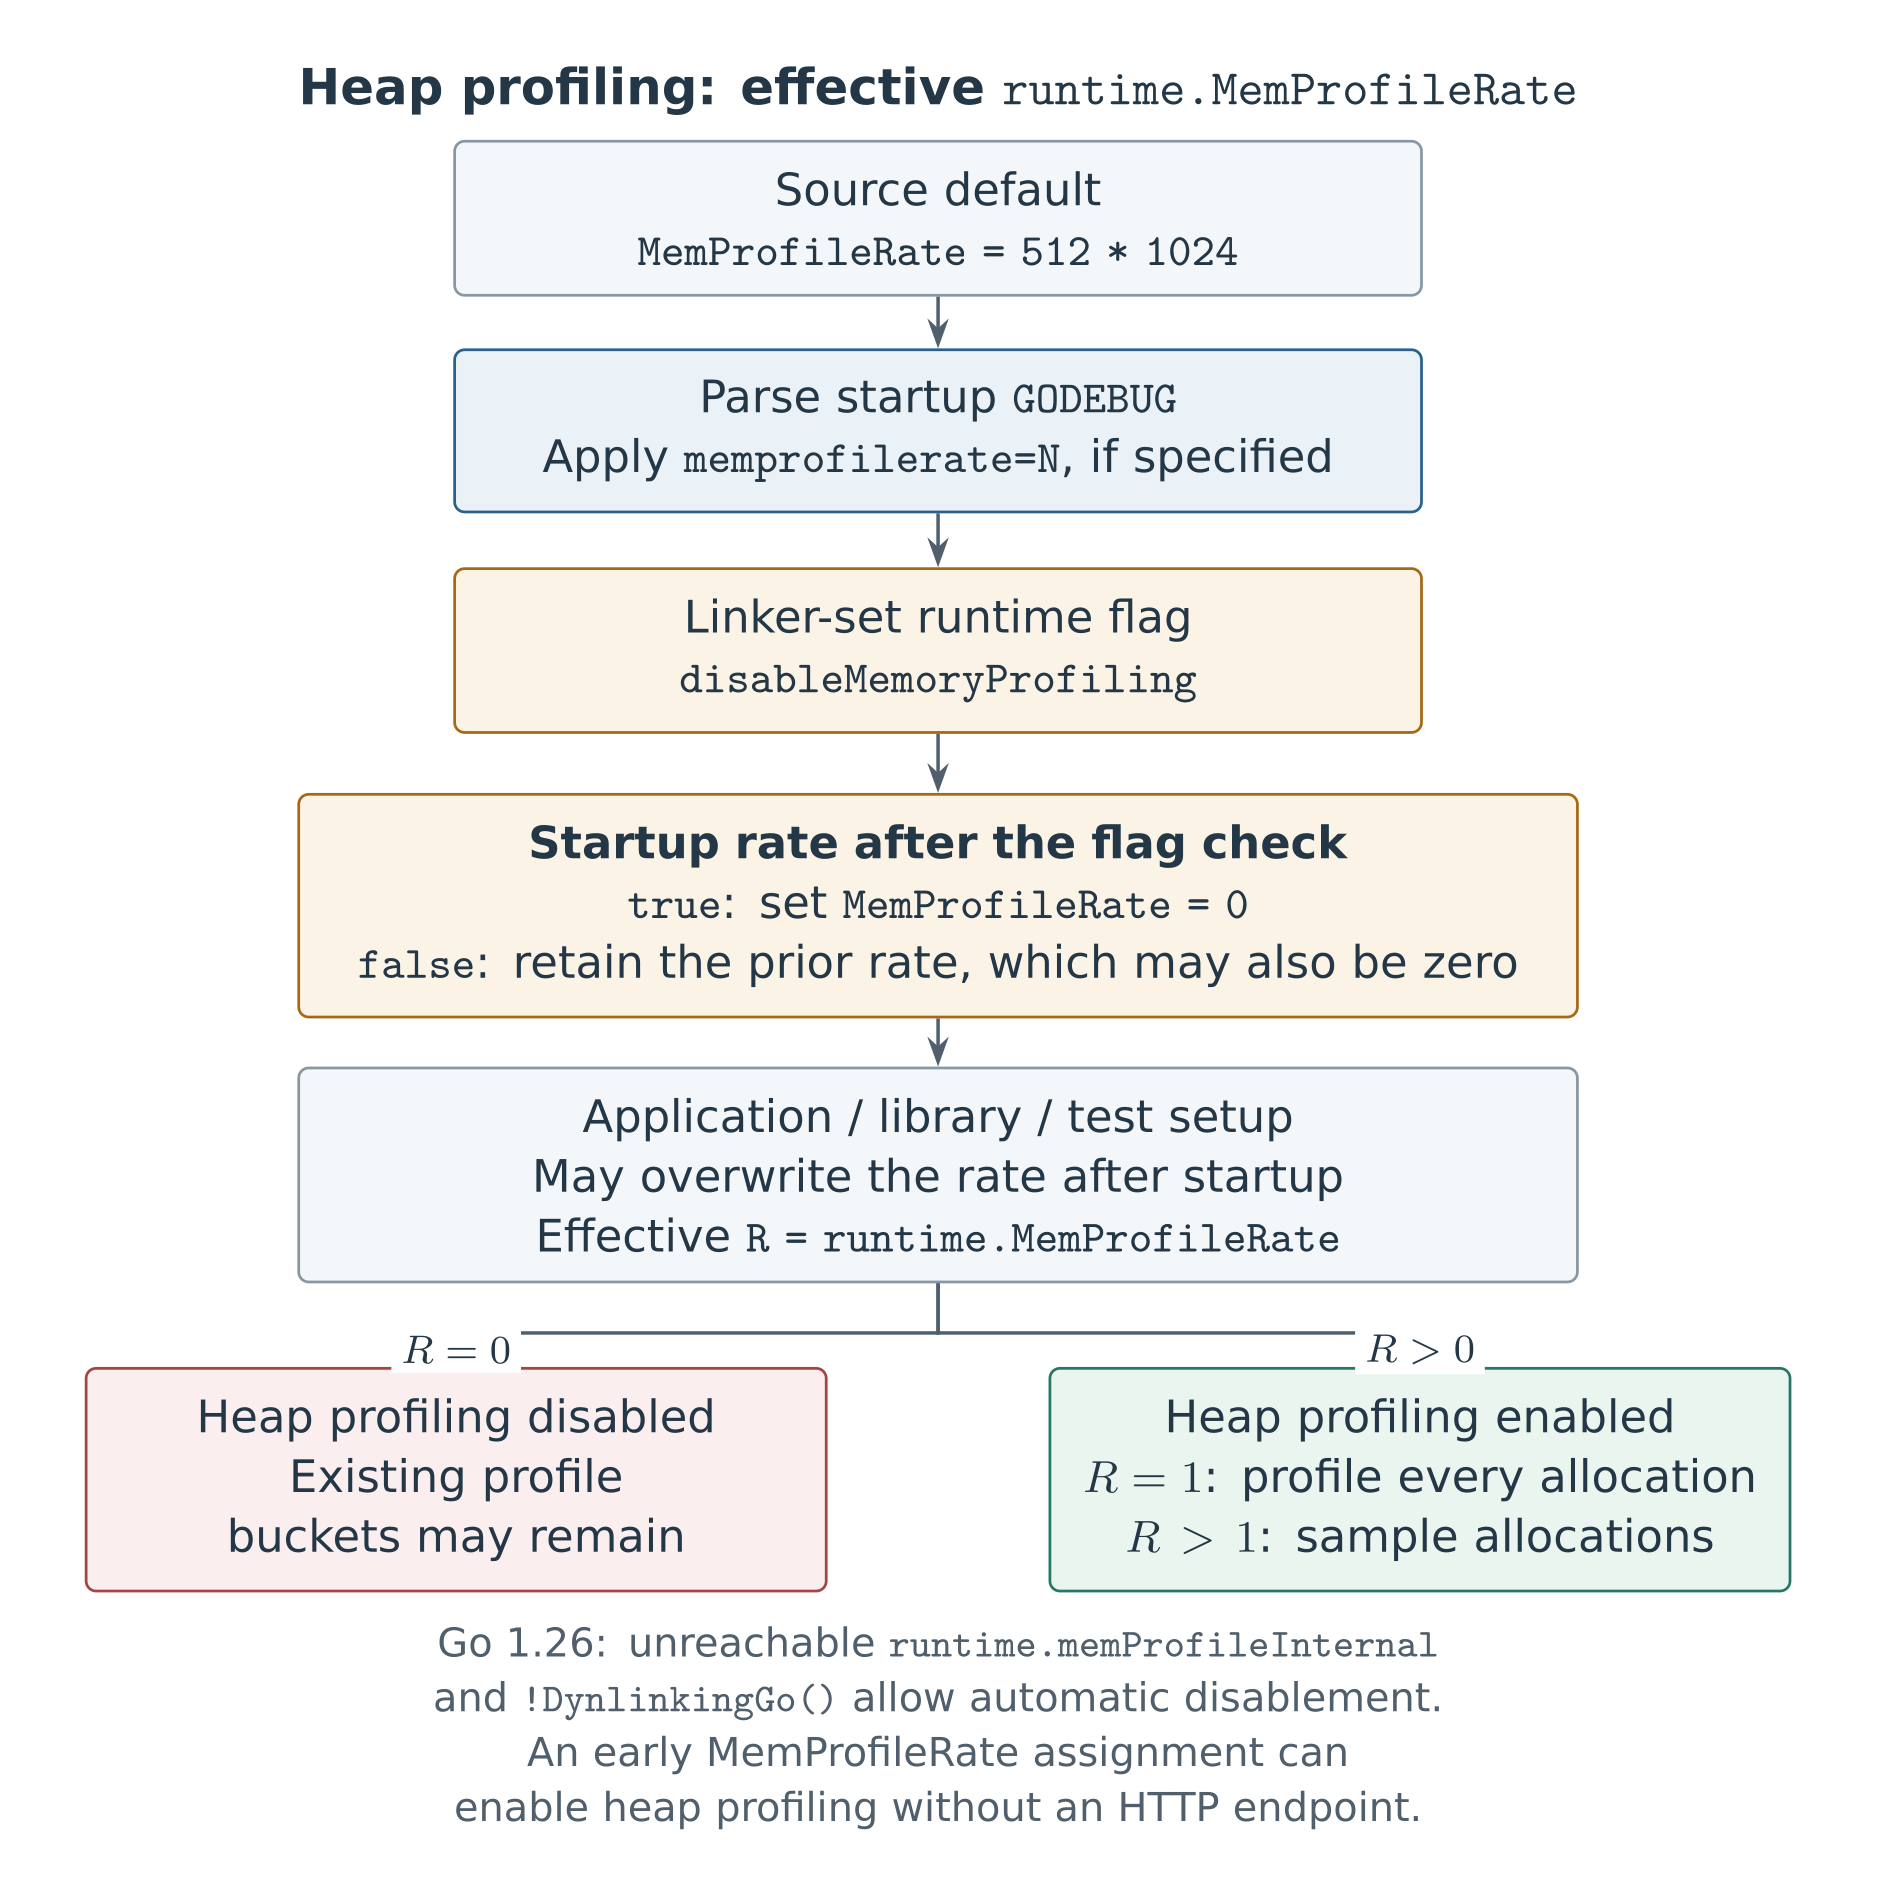
After parsing startup configuration, the runtime checks disableMemoryProfiling. If it is true, the runtime sets MemProfileRate to zero. If it is false, the previous value is retained, and that value may already be zero. A false flag therefore does not imply that sampling is enabled, and a positive GODEBUG=memprofilerate=... setting alone does not guarantee it. The application can subsequently enable sampling by assigning MemProfileRate, without explicitly calling runtime.MemProfile or starting an HTTP server. This affects only later allocations; it cannot reconstruct allocations that were never sampled. Startup order, Allocation sampling
The official TestMemProfileCheck verifies that reachable uses of runtime.MemProfile, pprof.WriteHeapProfile, pprof.Lookup("heap"), or pprof.Profiles(), as well as a blank import _ "net/http/pprof", can retain the default sampling path. Dependencies may make these paths reachable indirectly. If the rate is subsequently set to 0, sampling still stops. Official test
3.4 Bucket Keys and Linked Lists
The runtime groups samples by (profile type, full allocation stack, allocation size). Different allocation sizes at the same stack use different buckets; multiple equal-sized samples can share one bucket. Reclaiming an object increments free counters without deleting the bucket.
Figure 6: The hash chain supports lookup; the allnext chain supports traversal.
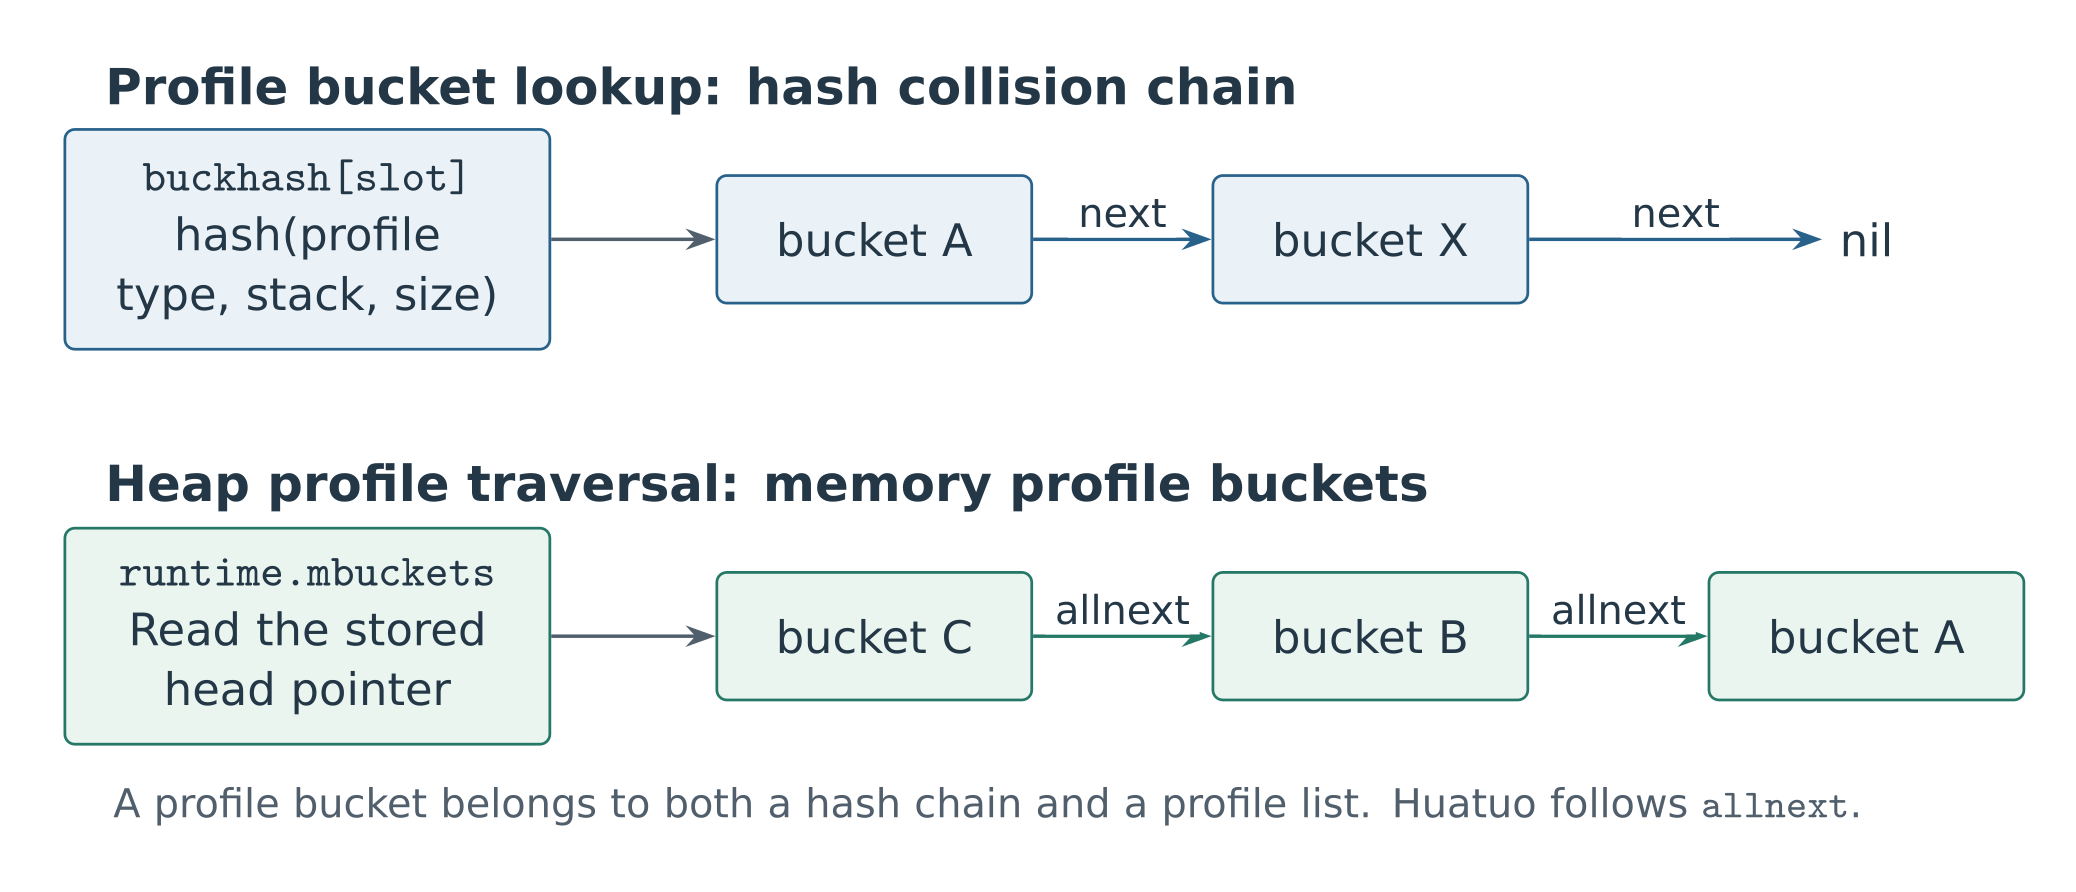
Huatuo first reads the head pointer stored in runtime.mbuckets, then follows allnext. The next field links collision entries within one hash slot and serves a different purpose. Buckets are allocated by the persistent allocator and prepended to the profile list. Existing headers, stacks, and links remain unchanged while counters continue to update. bucket and stkbucket
3.5 Bucket Layout and Counter Fields
In the 64-bit layouts examined here, a bucket consists of a 48-byte header, nstk PCs, and a 128-byte counter record stored contiguously. The PC area is not a slice header, nor does it reserve space for the maximum stack depth.
Figure 7: Bucket memory layout; offsets are in bytes.
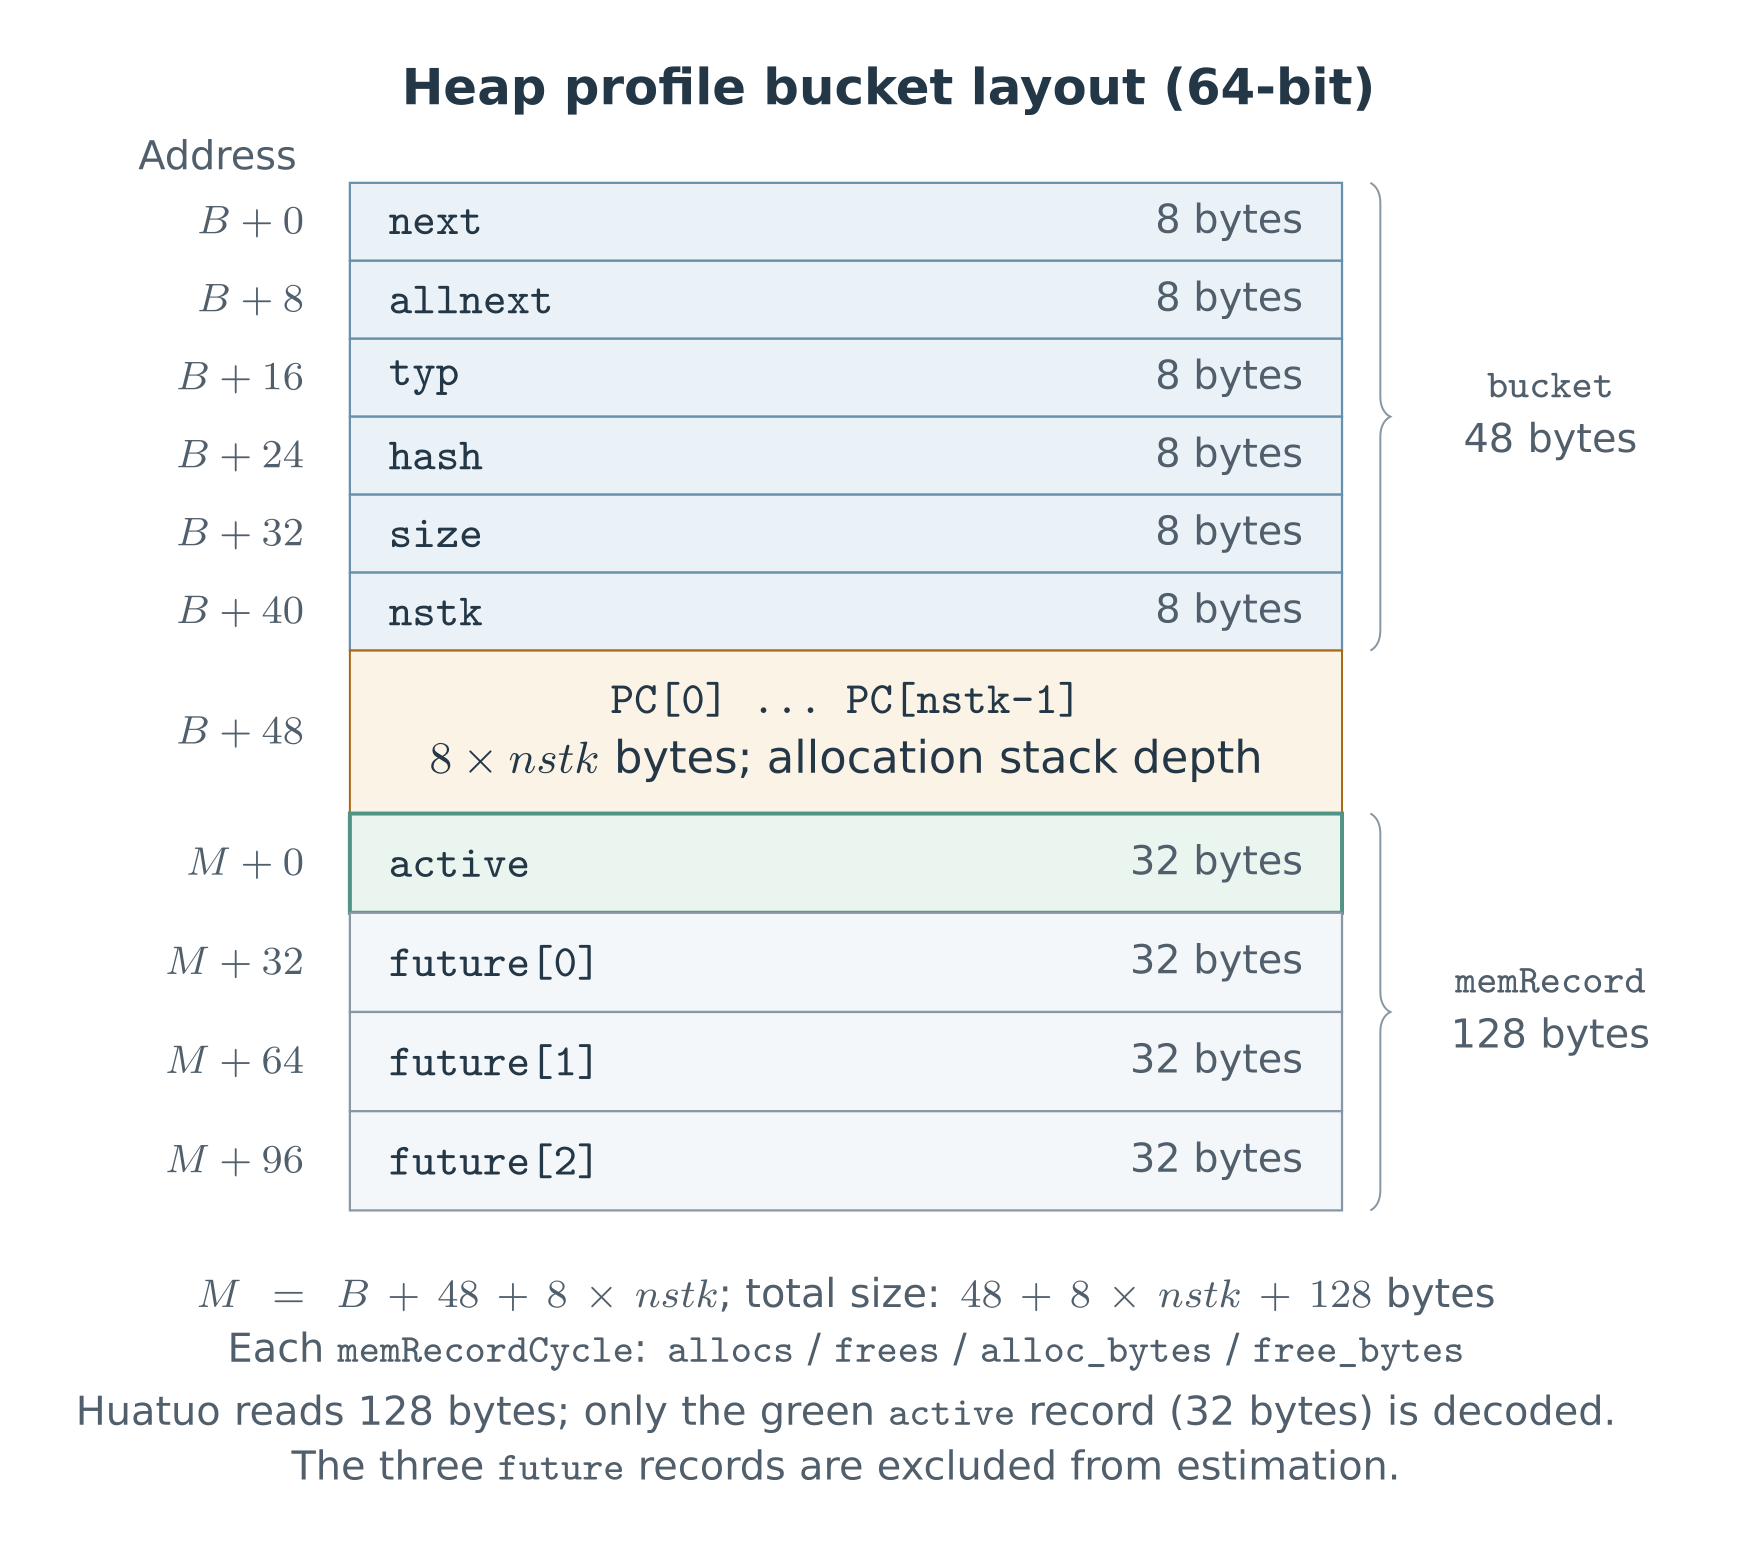
Each memRecordCycle contains four uintptr sample counters:
Table 4: Field layout of a 64-bit memRecordCycle.
| Relative offset | Field | Meaning |
|---|---|---|
| 0 | allocs |
Allocation count |
| 8 | frees |
Recorded free count |
| 16 | alloc_bytes |
Allocated bytes |
| 24 | free_bytes |
Recorded freed bytes |
active holds published cumulative values. The three future slots hold increments for different cycles, so the four records represent different time ranges. Go 1.26 layout
|
|
3.6 GC Cycles and Publication of Statistics
Allocations are accounted for when sampling selects them; frees are accounted for during sweeping. At mark termination (MT), free accounting for that GC cycle is not yet complete. active/future aligns the accounting boundaries for allocations and frees, while the associated locks protect concurrent updates.
The following analysis uses the default concurrent GC in Go 1.26.0. Let C be the global heap profile cycle.
Table 5: Counter updates for allocation, free, and publication events.
| Event | Accounting location | Update |
|---|---|---|
Sampled allocation, mProf_Malloc |
future[(C+2)%3] |
Increment allocation count and allocated bytes |
Sweep free, mProf_Free |
future[(C+1)%3] |
Increment free count and freed bytes |
Normal publication, mProf_Flush |
future[C%3] → active |
Add each of the four counters, then clear the slot |
The array does not move or exchange addresses with active. As C advances, the three physical slots rotate through the roles of ready for publication, receiving frees, and receiving allocations. The ready-to-publish data needs a separate slot because the cycle advances during stop-the-world (STW), while the more expensive flush runs after the world restarts.
Mark termination aligns the slot offsets. At C=k, an allocation is assigned to k+2. After MT advances the cycle to C=k+1, sweep frees are assigned to (k+1)+1=k+2. Both events therefore enter the same physical slot.
Figure 8: A group of samples from allocation through reclamation to publication; each dot represents 10 sampled objects.
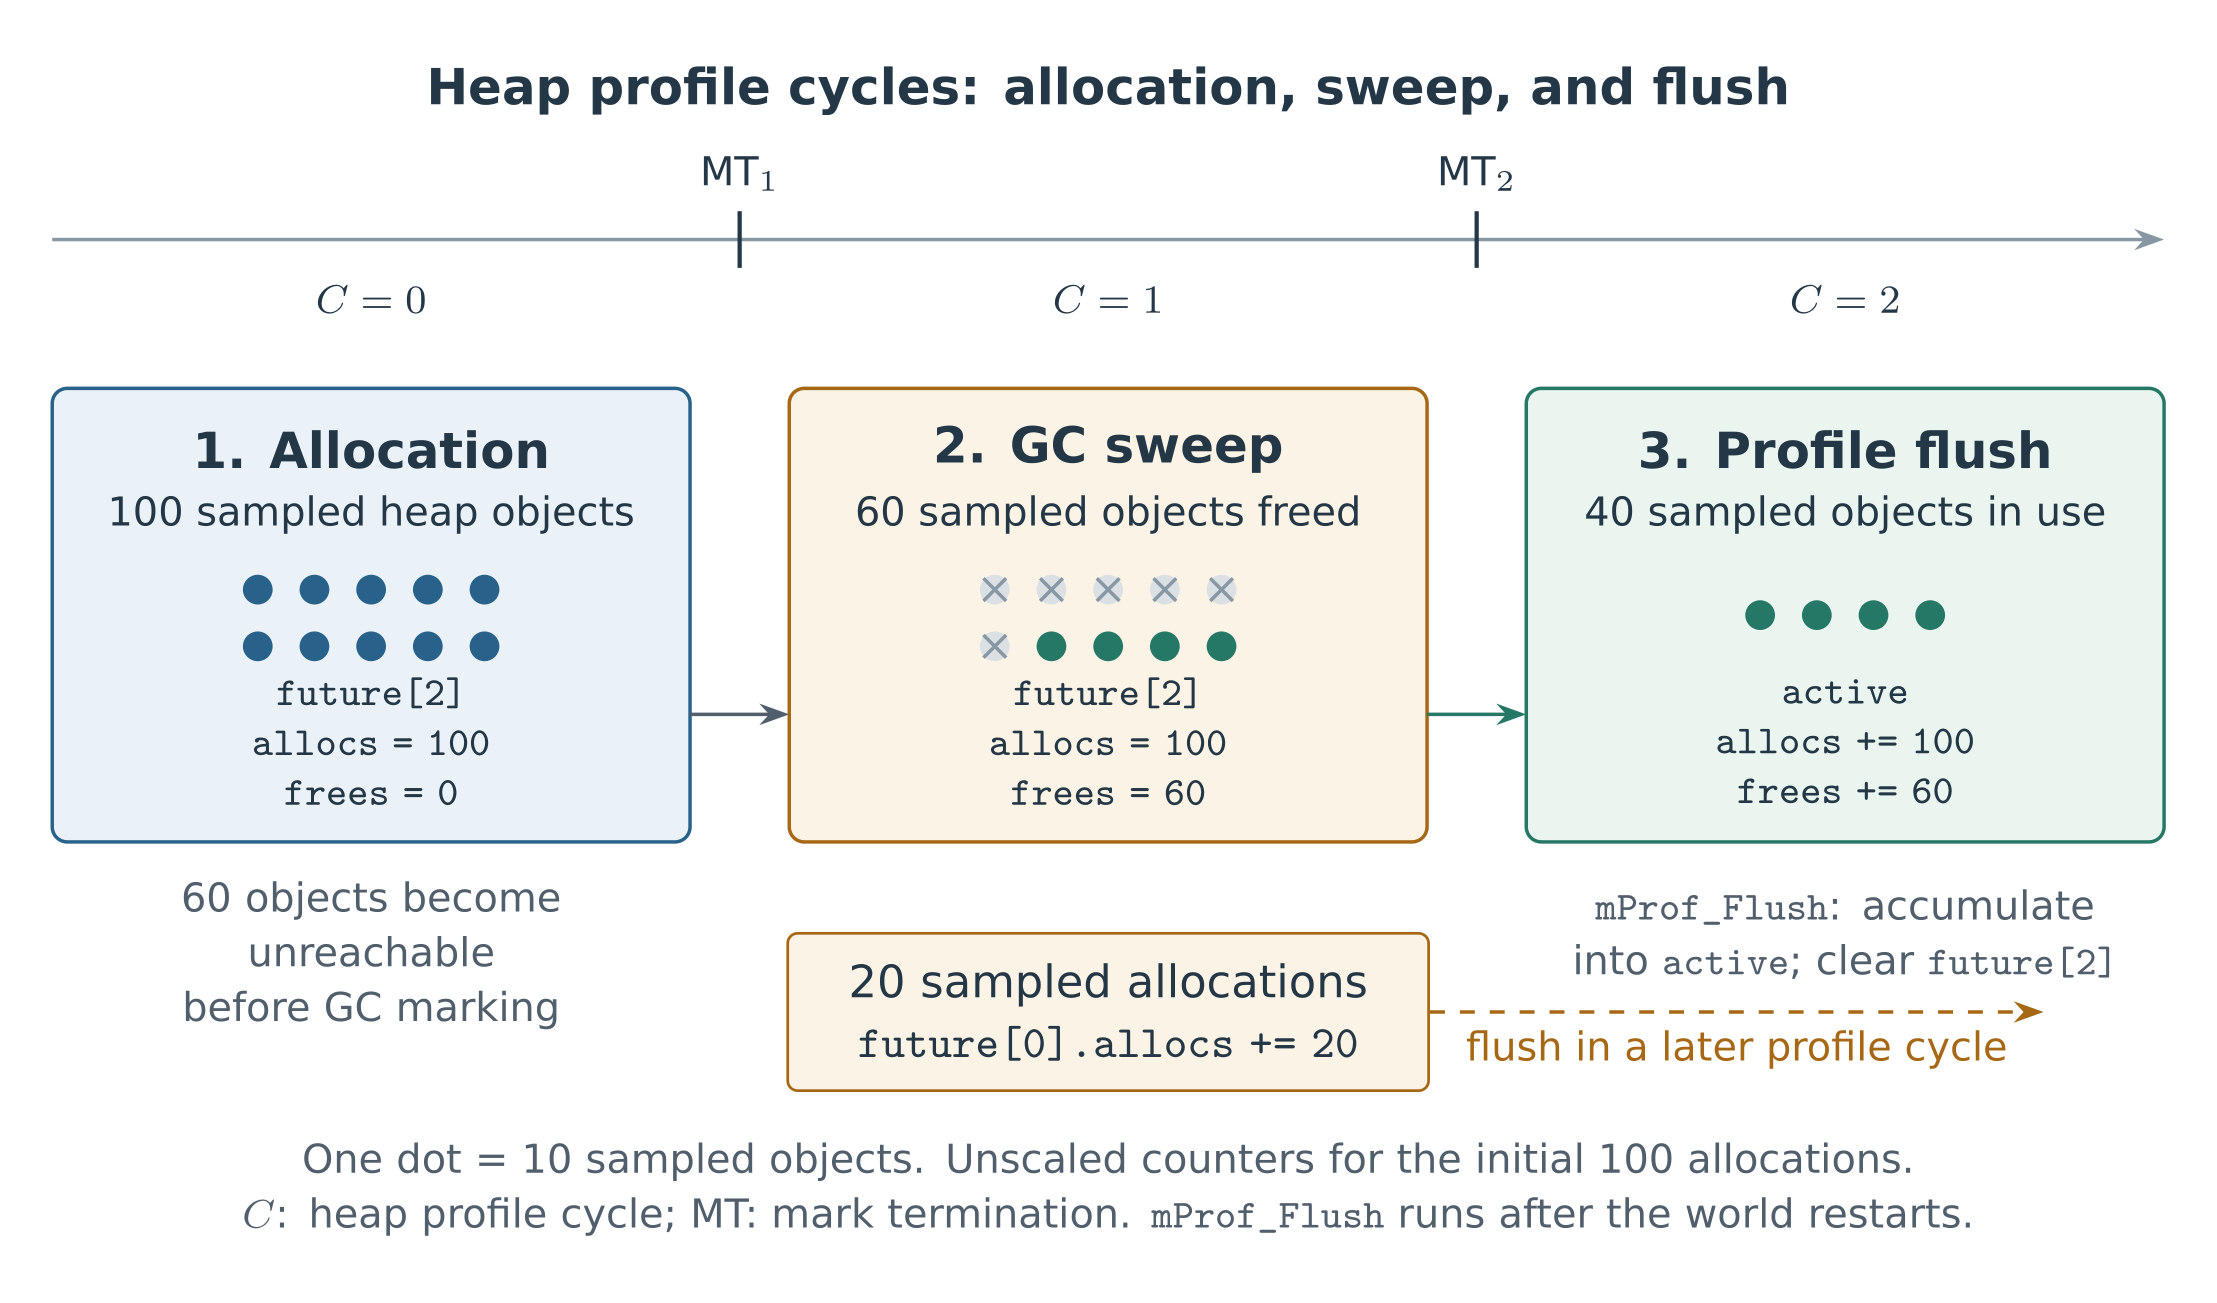
The figure omits earlier cumulative values. GC phase ordering provides the normal publication condition: the previous sweep must finish before the next mark phase, so the free events associated with MT₁ have been accounted for by MT₂. A long-lived object’s allocation may already be in active; its free is added to the same bucket in a later cycle.
After sample scaling, the counters correspond to pprof’s four sample types:
|
|
Huatuo reads cumulative allocation and free counters only from active, subtracts them, and scales the result. Increments in future contribute only after the runtime publishes them. This preserves the cycle alignment between allocations and frees.
4. Huatuo’s Out-of-Process Collection Method
4.1 Process Identity and Address Resolution
Huatuo checks process identity using TGID + StartTimeTicks, opens /proc/<pid>/exe to read ELF and Go build information, and keeps the file handle open through symbolization. The current implementation accepts ELF64 and Go 1.18–1.26, decodes values using the target’s byte order, and supports stripped-symbol recovery only on AMD64.
Figure 9: The data flow of one collection.
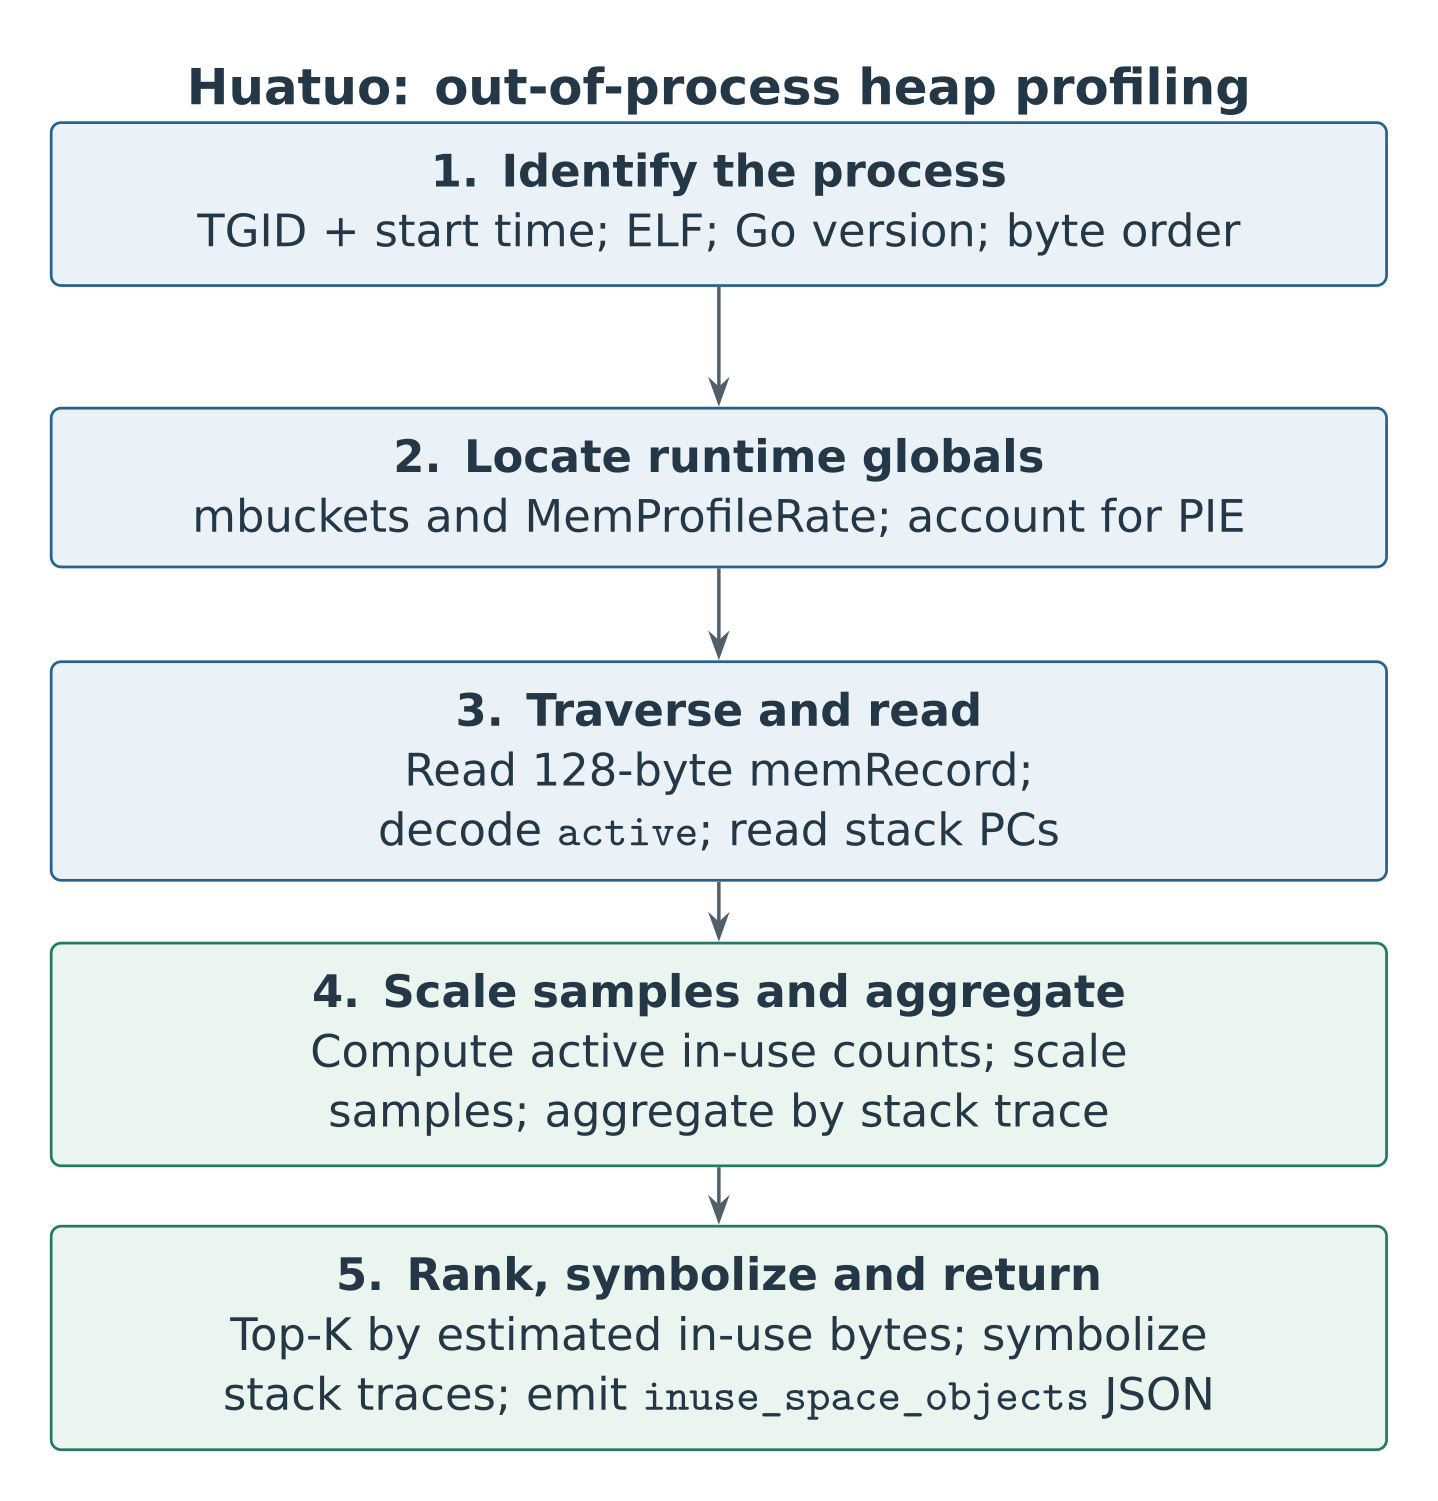
For a position-independent executable (PIE), runtime addresses are computed using /proc/<pid>/maps, executable identity, and PT_LOAD segments:
|
|
Subtracting one maps a return PC back into the address range of the call instruction. The relevant functions are resolveExecutableLoadBias in process_linux.go, newRuntimeInfo in runtime.go, and resolve in symbols.go.
4.2 Locating Globals and Reading the Sampling Rate
The collector first searches the ELF .symtab and .dynsym tables for runtime.mbuckets and runtime.MemProfileRate, subject to the metadata parsing budget. If the variable symbols are missing, the AMD64 path uses pclntab to find runtime functions that access those variables, then decodes their machine instructions. pclntab itself does not provide global-variable addresses.
Figure 10: Recovering addresses after ELF symbols have been stripped.
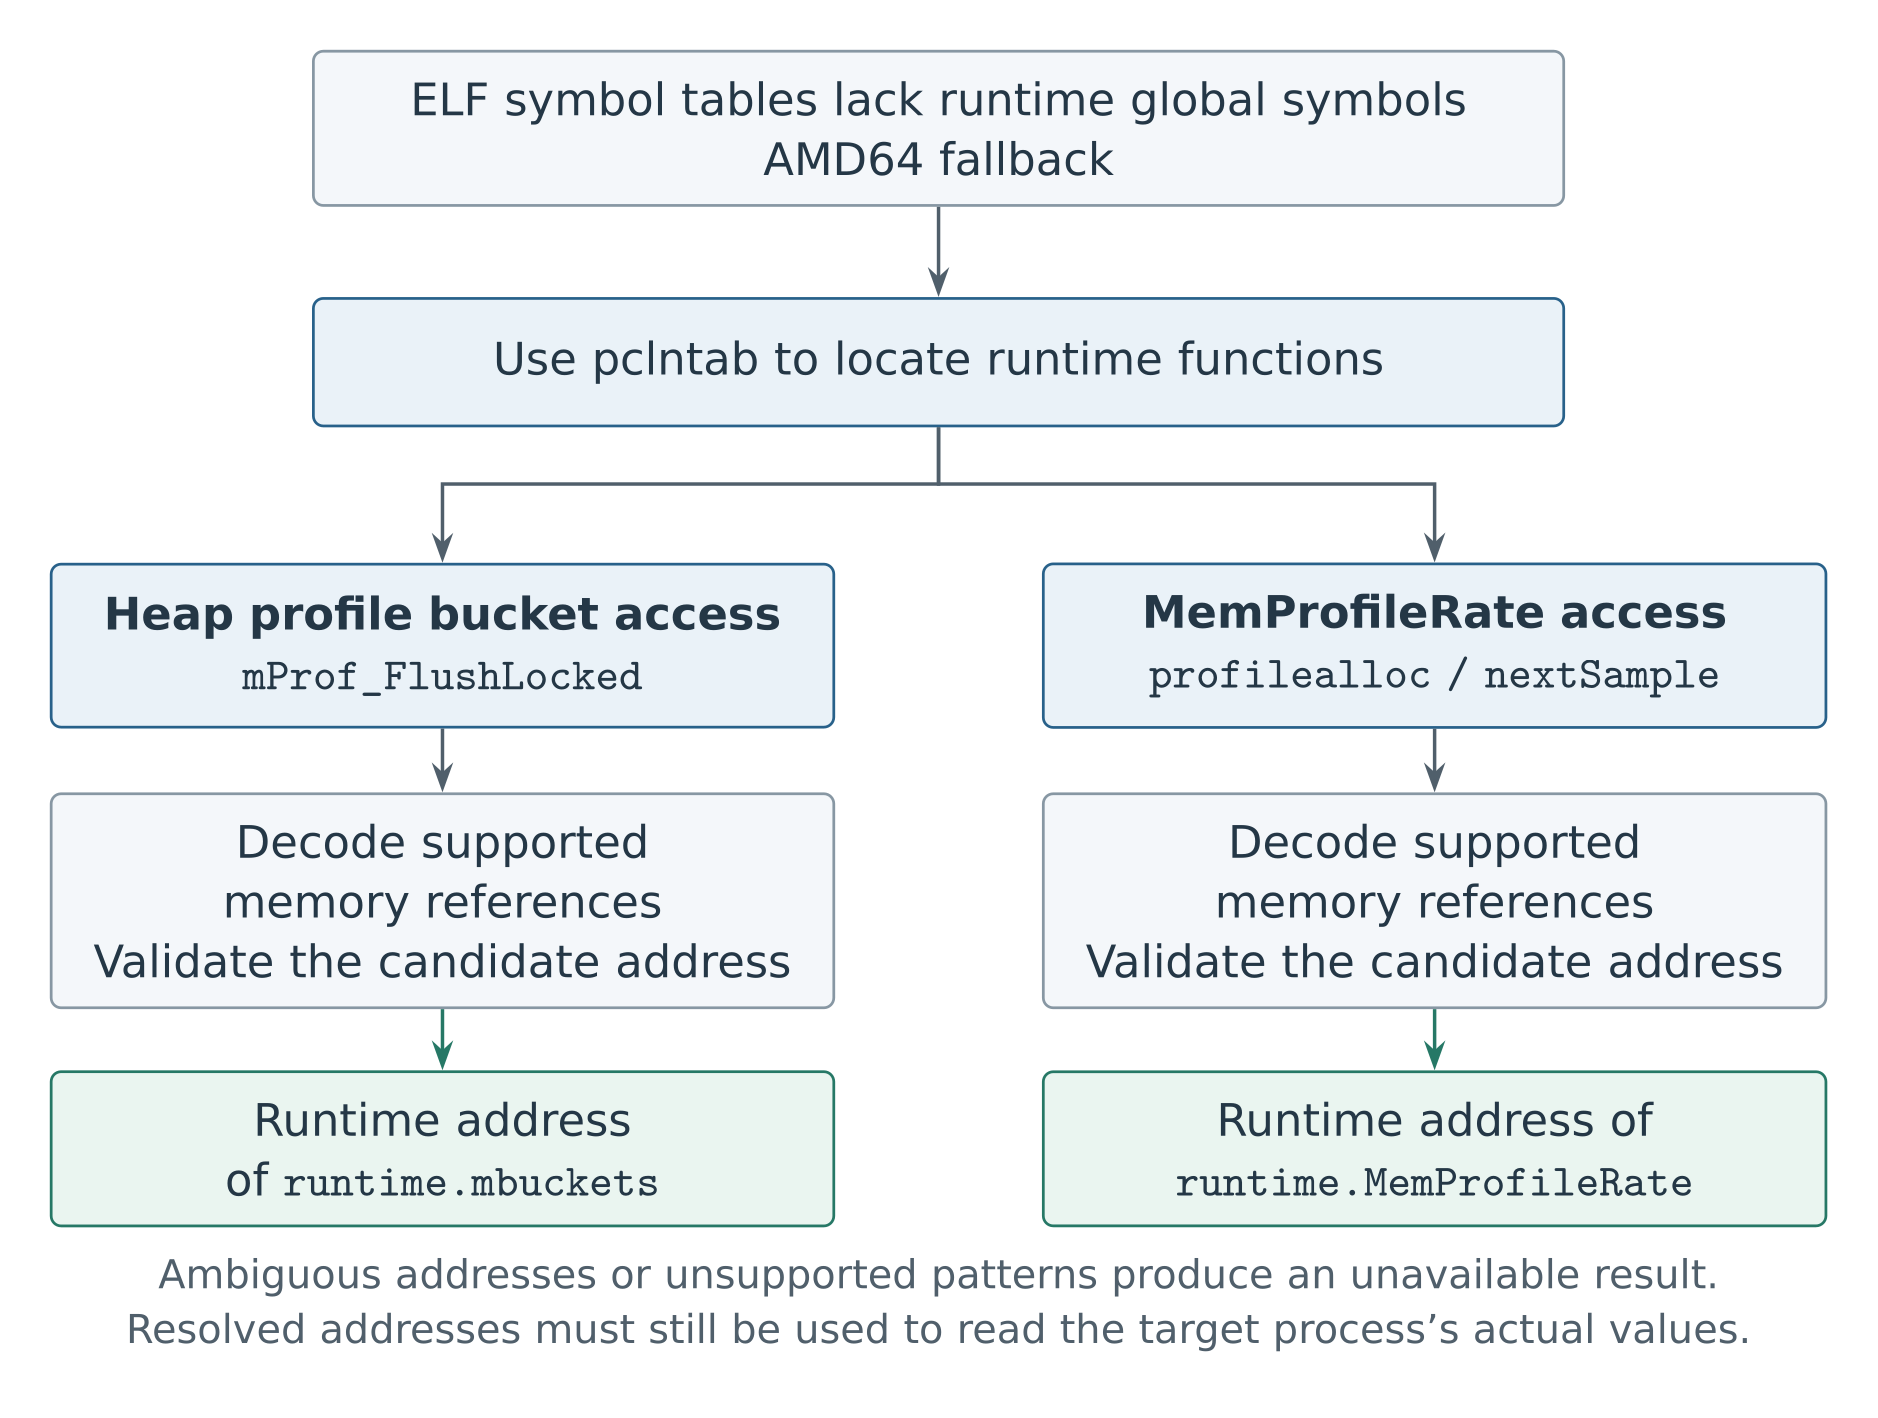
Ambiguous addresses or unsupported instruction patterns make collection unavailable. After resolving the addresses, the collector must still read the actual sampling rate. R=0 means sampling is disabled; a failed rate read cannot be replaced with the default value. Recovery depends on compiler instruction patterns and does not guarantee support for arbitrary obfuscation, executable packing, or custom toolchains. See stripped_symbols.go and internal/symbol/elf_symbols.go.
4.3 Bucket Traversal and Batched Reads
Linked-list addresses must be discovered one node at a time. Huatuo follows allnext, reading a 48-byte header per bucket and collecting up to 64 buckets per batch. readMemRecords still reads the entire 128-byte memRecord for each bucket, but decodeCounters interprets only its first 32 bytes, which hold active. Thus, using only active changes which counters contribute to the estimate; it does not reduce each remote record read to 32 bytes. Stack traces are then read only for buckets with nonzero in-use object counts, byte counts, and stack depths.
Figure 11: Three read stages with buffers reused across batches.
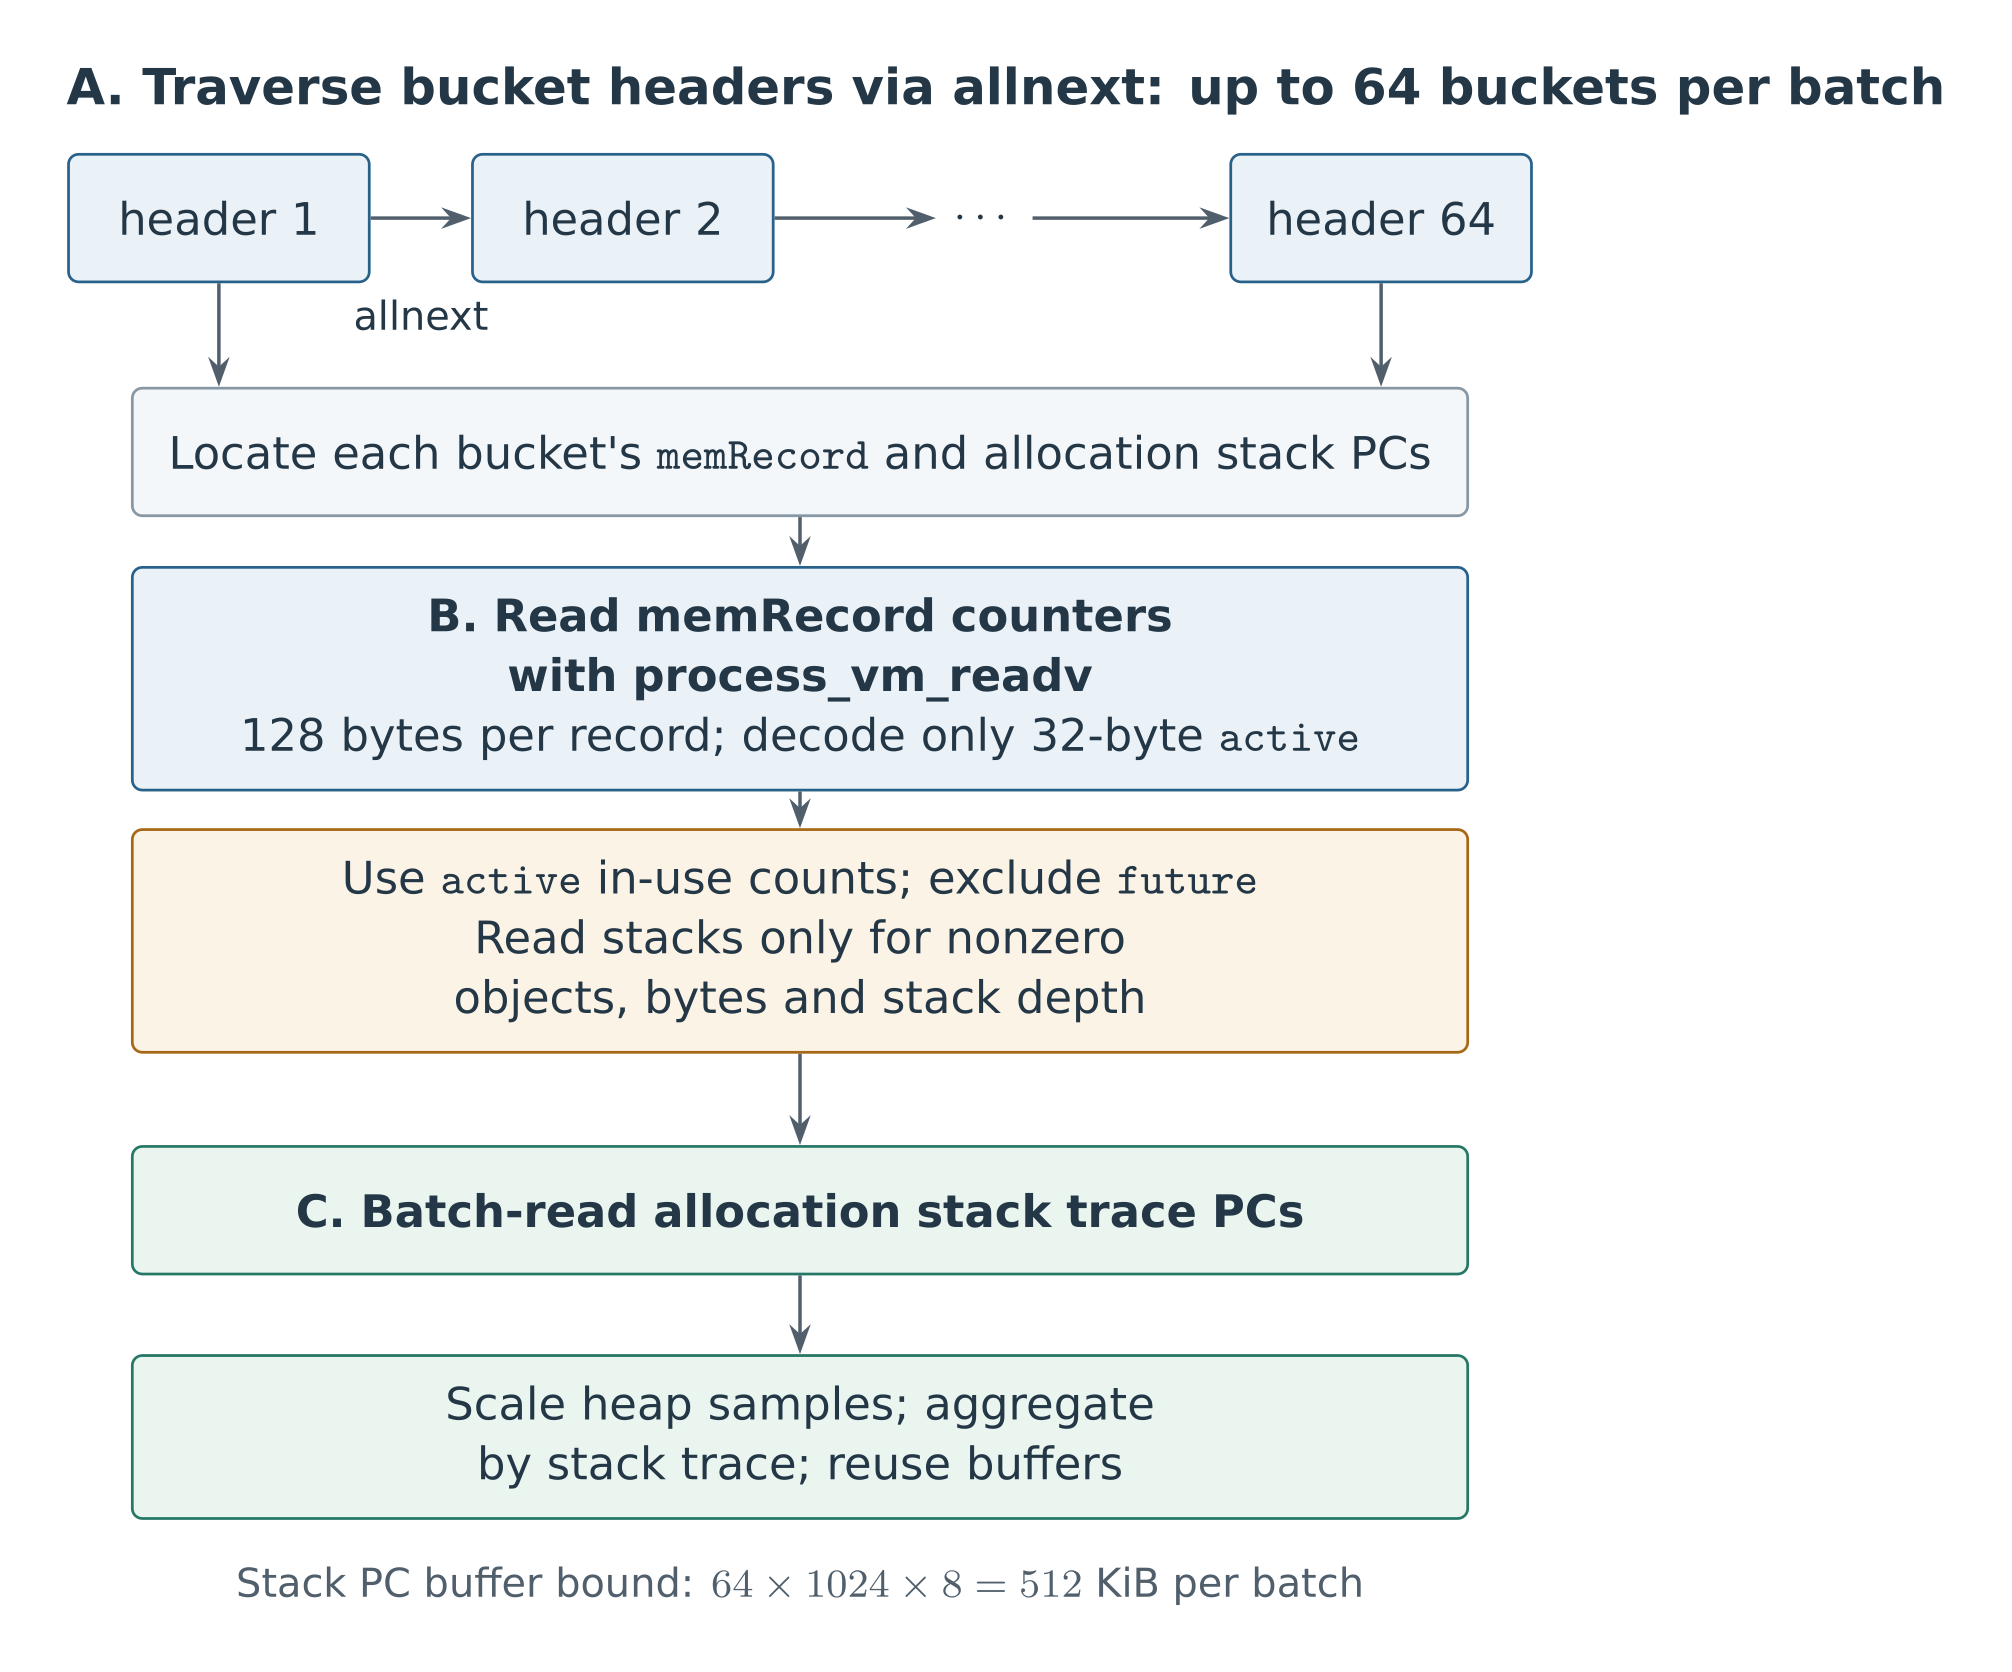
The PC buffer is bounded by 64 × 1024 × 8 = 512 KiB per batch. Stack keys retained in the aggregation table are copied. Batching reduces system calls for records and stacks, while header reads still grow linearly with the number of buckets. See memory_linux.go and bucket.go; Section 4.4 discusses read consistency.
4.4 In-Use Counts and Read Consistency
decodeCounters in runtime_layout.go uses only the four counters in memRecord.active:
|
|
future[0..2] does not contribute to these differences. In Figure 8, publishing 100 allocations and 60 frees into active contributes 40 in-use samples. The 20 new allocations still in future[0] are excluded from this estimate. This preserves the runtime’s publication delay and avoids including recent allocations before their accounting has been aligned with sweep frees.
Huatuo reads data that has already been published. It does not acquire runtime locks or actively flush pending cycles. By comparison, MemProfile/pprof processes eligible cycles under locks before reading active; when no published history exists, it may also merge future into active. The two paths therefore use the same kind of published statistics but do not guarantee identical collection times or results. memProfileInternal
Reading only active is still not atomic. A flush updates several fields and traverses multiple buckets, so an external reader can observe different stages of those updates. Figure 12 uses unscaled object counts: before the flush, allocs=100 and frees=60; the pending increment is 20 allocations and 10 frees. After the complete flush, 50 objects are in use. Reading the new allocation count with the old free count yields 60; combining the old allocation count with the new free count yields 30.
Figure 12: Concurrent field reads can produce inconsistent in-use counts even when only active is used.
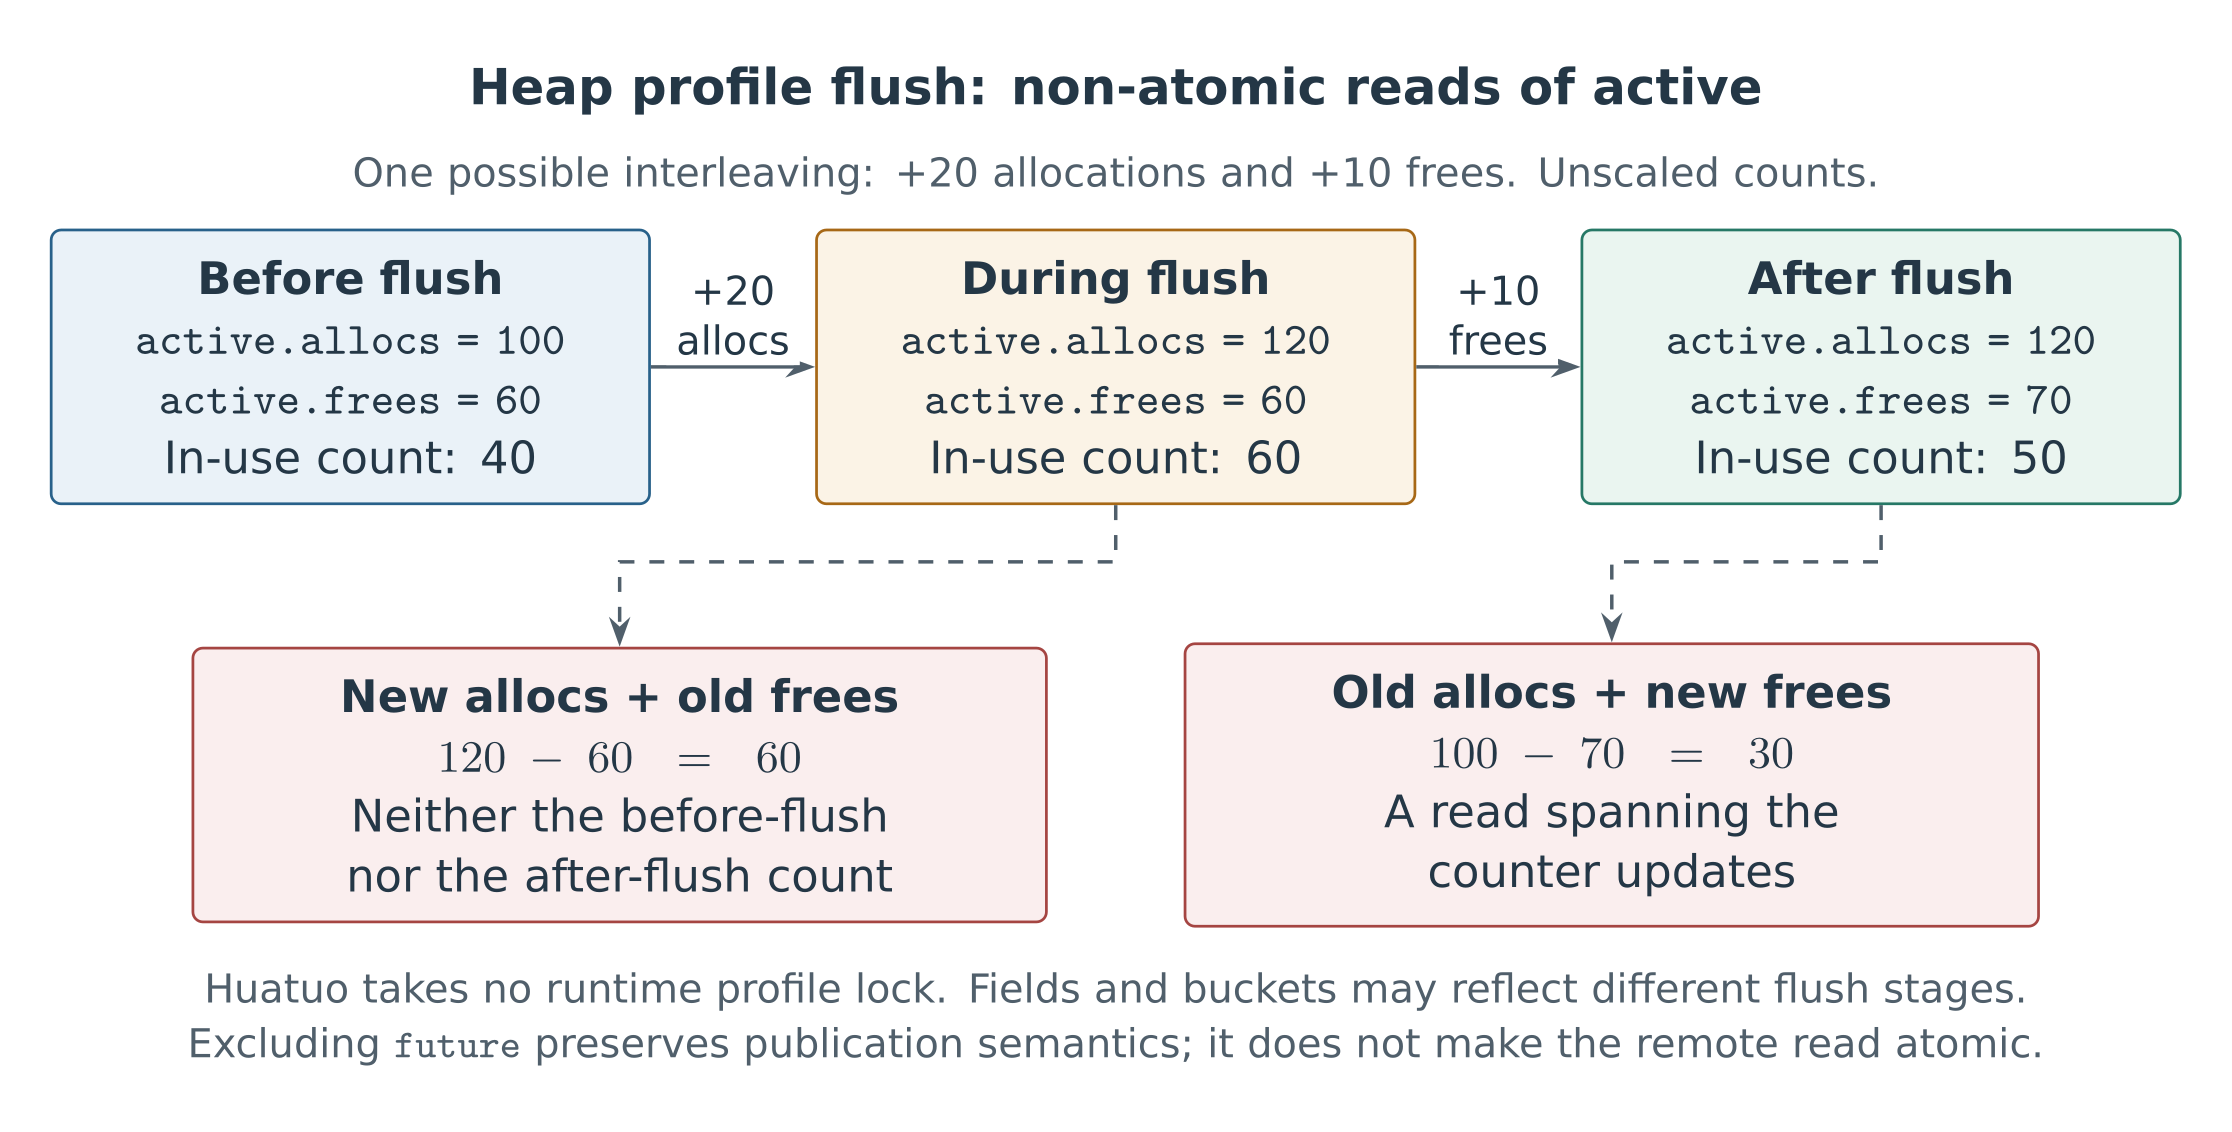
Clamping a negative difference to zero prevents subtraction underflow but cannot restore consistency. Buckets may also be at different publication stages, and newly inserted buckets may be absent from the list view being traversed. status=complete therefore means traversal completed, not that the result is an atomic snapshot or the size of the currently reachable heap. mProf_FlushLocked
4.5 Sample Scaling, Stack Aggregation, and Symbolization
For nonzero in-use samples obtained from active and R=MemProfileRate>1, Huatuo uses pprof’s sampling correction model. No scaling is applied at R=1:
|
|
For example, 100 in-use samples of 4 KiB each, with R=512 KiB, yield about 12,850 objects and 52,633,866 bytes (50.20 MiB) under this formula and integer truncation. These values illustrate the calculation; they are not accuracy measurements.
Figure 13: Scale by allocation size before combining buckets with the same stack.
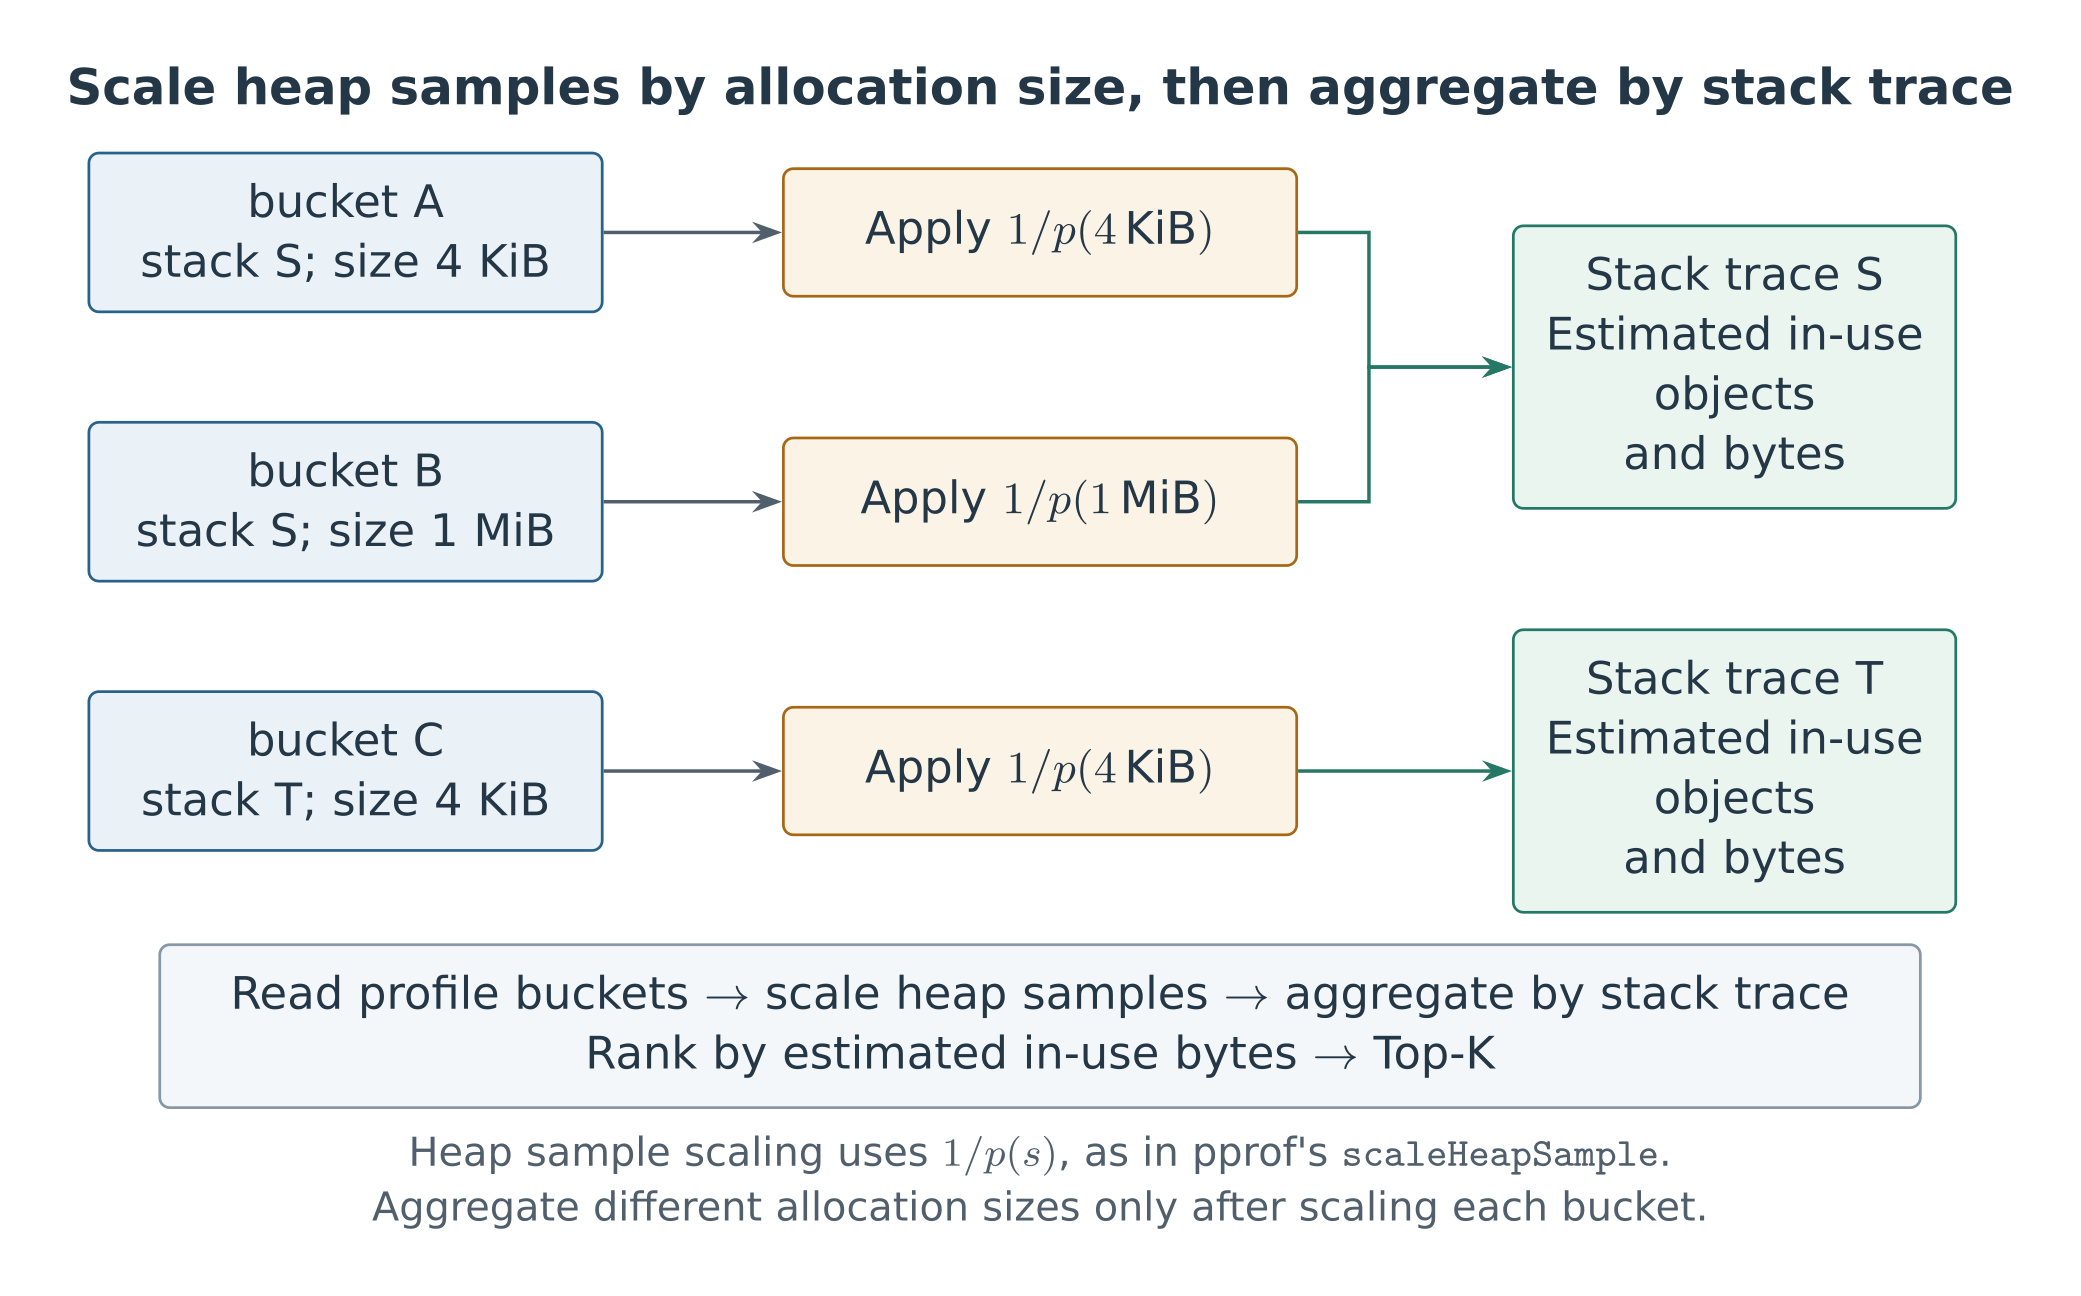
Buckets with different allocation sizes have different sampling probabilities. Combining them before scaling changes their weights. The implementation therefore scales each bucket before aggregating by stack trace, as implemented by addSample and scaleHeapSample in aggregate.go. MaxMemoryObjectEntries limits only the final output. If a scan is constrained by its budget, rankings cover only the portion read.
The aggregation key is the raw PC sequence; symbolization happens afterward. name uses the first non-runtime function, and stack holds the resolved stack. Distinct PC stacks do not necessarily merge even if they resolve to the same function names. Comparisons across processes also need to account for PIE and program versions.
4.6 Output Representation and Field Semantics
The snapshot uses inuse_space_objects for results grouped by allocation stack trace. The JSON below is a structural example. All values, including duration_ms, illustrate the fields rather than report a performance measurement:
|
|
bytes and objects are in-use estimates obtained by scaling the differences in active. average_bytes is their quotient and can be affected by integer truncation; it is not a Go type’s sizeof. The output does not contain individual object addresses, types, source lines, or reference relationships. A PC that cannot be resolved may appear as a hexadecimal address. Failure to build the symbol table as a whole returns an error.
5. Limitations and Scope
5.1 Sampling Availability and Historical Coverage
The linker can disable heap sampling when the profile consumer is unreachable and the linking mode permits it, causing runtime startup to set MemProfileRate=0. Earlier versions check runtime.MemProfile; newer versions check runtime.memProfileInternal.
Huatuo currently returns unavailable when sampling is disabled. It does not write to the target process to enable sampling and cannot recover allocations that were never sampled. Set the sampling rate early in startup and keep it stable. If it changes during execution, the current value alone is insufficient to scale samples accumulated under earlier rates correctly. MemProfileRate contract
5.2 Estimation Error and Attribution Limits
Table 6: Limits on numerical estimates and memory attribution.
| Limitation | Effect |
|---|---|
| Sparse samples with large scaling weights | Estimates and hotspot rankings can fluctuate |
| active publication lags behind the current heap state | New allocations and later frees are not reflected until publication; the estimate is not the size of the currently reachable heap |
| No object types or reference relationships | Allocation stacks can be identified, but the code retaining an object cannot be determined directly |
Memory outside the Go heap and output limited by MaxMemoryObjectEntries |
Heap entries alone cannot explain all RSS or cgroup memory usage; Huatuo also collects these broader memory metrics |
5.3 Diagnostic Use
Figure 14: Interpreting a snapshot during an investigation.
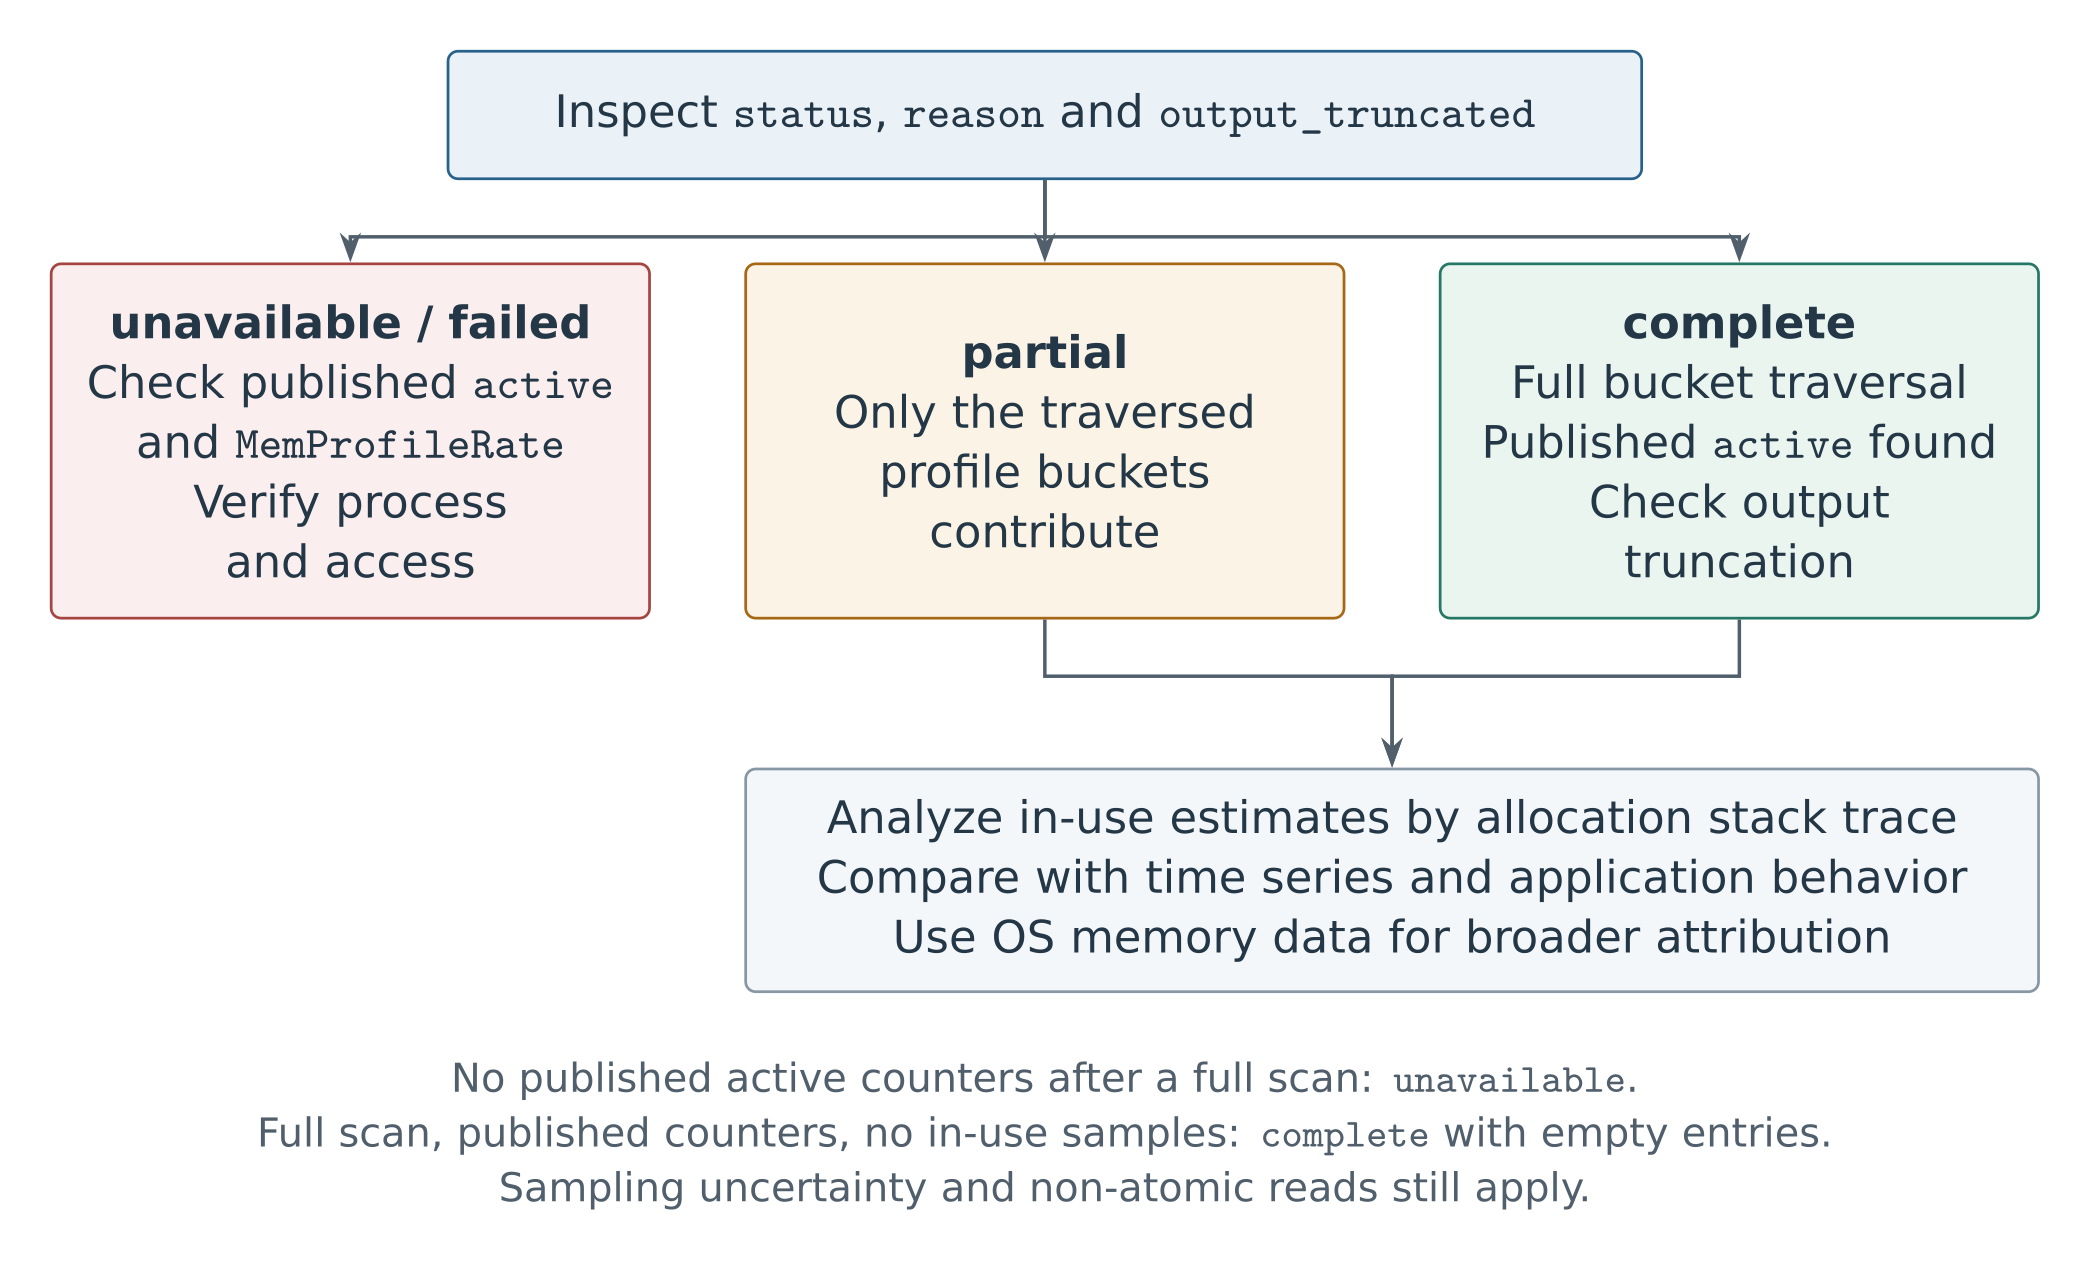
The snapshot can connect memory-pressure events to allocation call paths and identify likely retention hotspots. Establishing a leak, identifying what retains objects, or explaining all RSS still requires time-series data, application behavior, and runtime or operating-system measurements.
6. Conclusion
The Go runtime’s heap sampling statistics provide a data source for out-of-process memory attribution. Huatuo locates runtime globals, traverses profile buckets, computes in-use differences from active, scales the samples, and resolves allocation stacks to produce a snapshot of in-use heap hotspots associated with an event.
Using this method depends on sampling state, runtime layout, symbol resolution, and read permissions. Its output is an estimate based on published statistics read during a collection window. Using only active preserves the runtime’s publication delay, making the snapshot useful as evidence of where memory was allocated.
References
| Version tag | Runtime heap sampling source |
|---|---|
go1.18 |
runtime/mprof.go |
go1.19 |
runtime/mprof.go |
go1.20 |
runtime/mprof.go |
go1.21.0 |
runtime/mprof.go |
go1.22.0 |
runtime/mprof.go |
go1.23.0 |
runtime/mprof.go |
go1.24.0 |
runtime/mprof.go |
go1.25.0 |
runtime/mprof.go |
go1.26.0 |
runtime/mprof.go |
Other relevant sources include the Go 1.26 allocator, metadata linking sampled objects to profile buckets, pprof sample scaling, and the linker’s profiling disablement check.