

V2.3.0 Released
Overview
HUATUO v2.3.0 expands node-level kernel observability into a diagnostic workflow that covers anomaly detection, real-time forensics, performance profiling, and centralized queries.
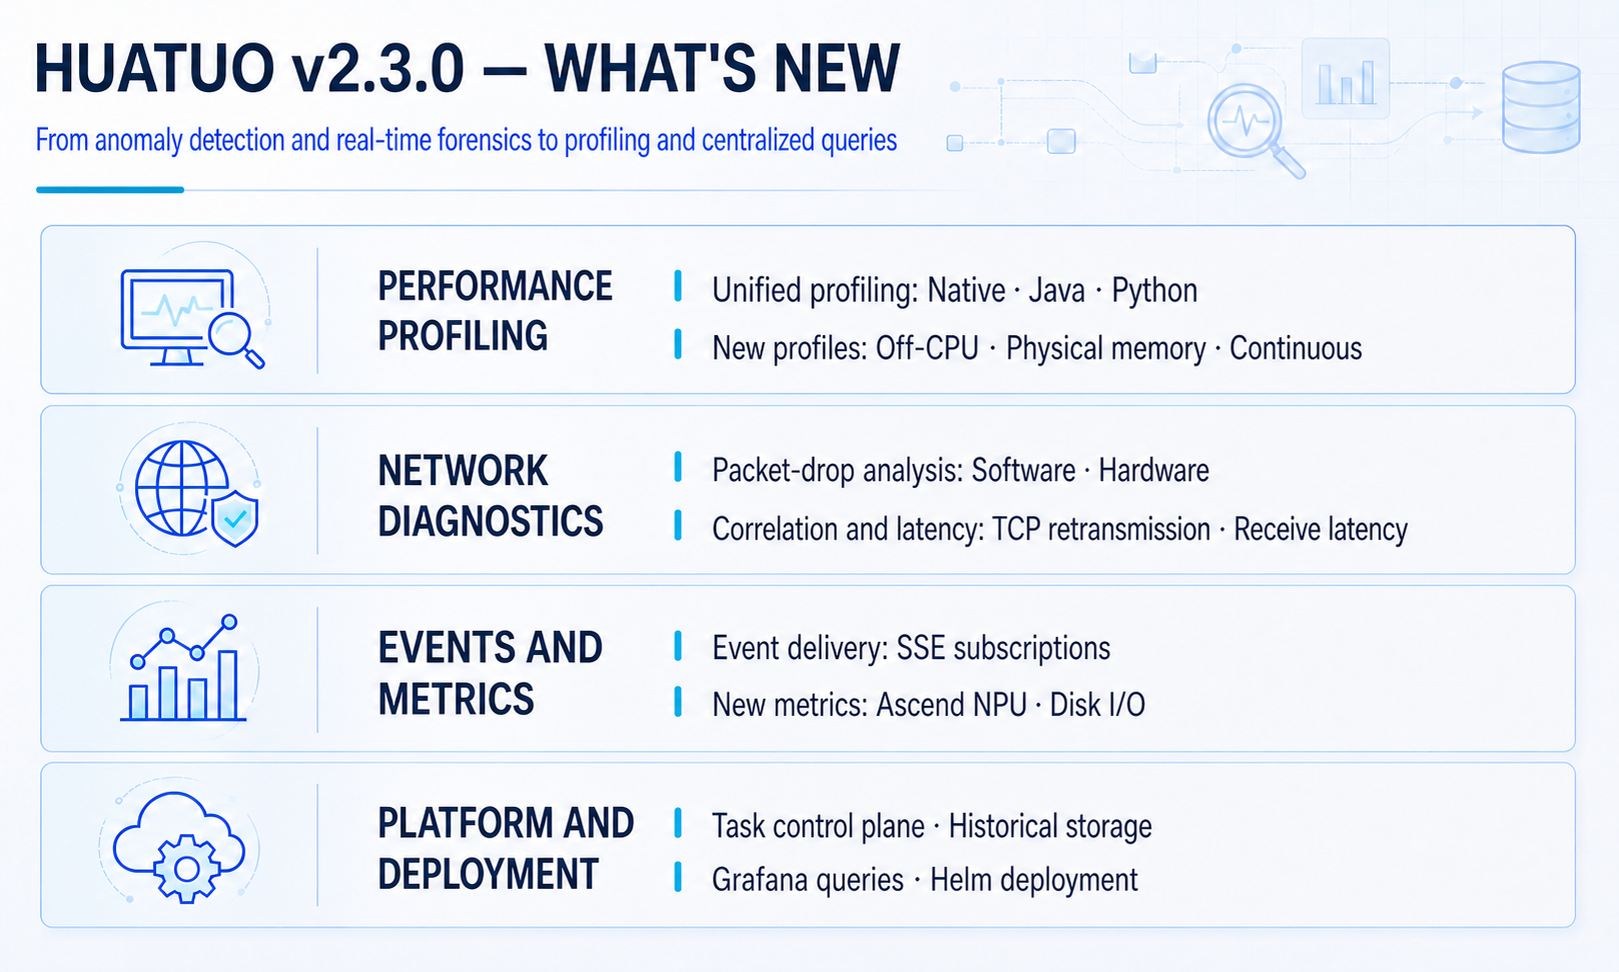
The sections below describe the main changes. For configuration and usage details, see the HUATUO documentation.
- Continuous profiling
- Anomaly diagnostics
- Kernel event subscriptions
- Network packet drops
- TCP retransmission tracing
- Hardware failures
- Storage service
- Cluster deployment
1. Performance Profiling
1.1 Unified Profiler
The new standalone profiler tool provides a single command-line interface for profiling native applications, Java, and Python:
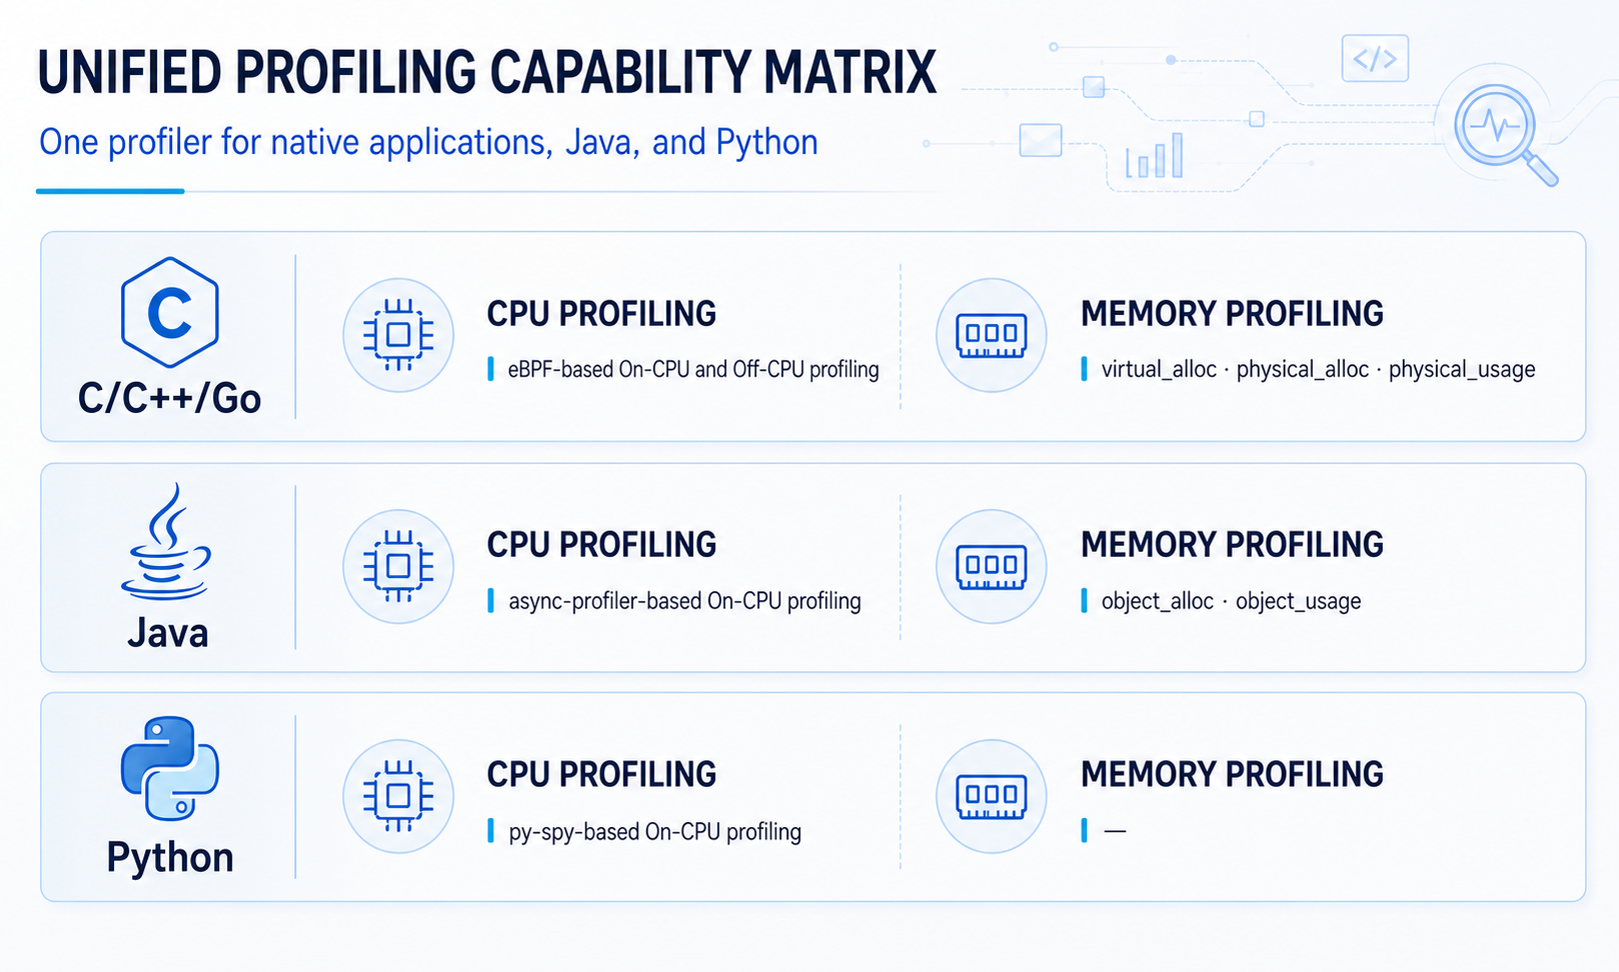
profiler supports host, PID, and container targets:
- Java and Python can profile multiple PIDs concurrently.
- Native applications can be profiled by thread group.
- Sampling can be restricted to a specified list or range of CPUs.
- Container processes are resolved locally through cgroups without relying on kubelet.
- Output options include collapsed stacks, interactive SVG flame graphs, and remote pprof export.
1.2 Off-CPU Profiling
Off-CPU profiling uses scheduler tracepoints such as sched_switch and sched_wakeup to measure the time from when a task leaves the CPU until it runs again. Wait time is classified by cause:
- blocked: The task is waiting for a lock, I/O, or another event.
- runqueue: The task is runnable but still waiting for CPU time in the run queue.
- runqueue_preempted and runqueue_yielded: These values identify why the task entered the run queue.
- runqueue_missed_wakeup: A conservative classification used when no wake-up event is observed.
Collection can be limited to blocked or runqueue samples, a minimum wait duration, and a selected set of CPUs. Diagnostic statistics for investigating BPF collection quality are disabled by default and can be enabled when needed.
1.3 Native Memory Profiling
- virtual_alloc: Attributes virtual address space allocations such as anonymous mappings.
- physical_alloc: Attributes new physical page allocations during the collection window.
- physical_usage: Tracks page allocations and releases, then reports call stacks for physical pages that remain resident when collection ends.
Physical memory events support probabilistic sampling to balance accuracy and overhead. physical_usage supports page and folio layouts across kernel versions, including batch release paths.
1.4 Continuous Profiling as a Service
The new huatuo-apiserver control plane and /v1/profiles API support:
- Querying the languages, CPU modes, and memory modes supported by the server.
- Creating, listing, stopping, and deleting profiling tasks, with pagination for list queries.
- Dispatching tasks to node Agents by host, container, and process.
- Aggregating and persisting long-running profiling data in fixed windows.
- Querying raw results and connecting Grafana through a Pyroscope-compatible API.
- Persisting task state and recovering incomplete tasks after a service restart.
- Controlling access through bearer tokens, path permissions, and concurrency quotas.
Separate Grafana continuous profiling dashboards are available for hosts and containers. When profiling data storage is disabled, the API Server can still provide task control and capability queries.
1.5 Terminal Flame Graphs
The perf tool now provides a TUI flame graph for expanding, collapsing, and browsing call stacks directly in an SSH terminal. Results do not need to be transferred to a browser, making the interface suitable for on-demand diagnostics in restricted production environments.
2. Network and Event Diagnostics
2.1 Software and Hardware Packet Drops
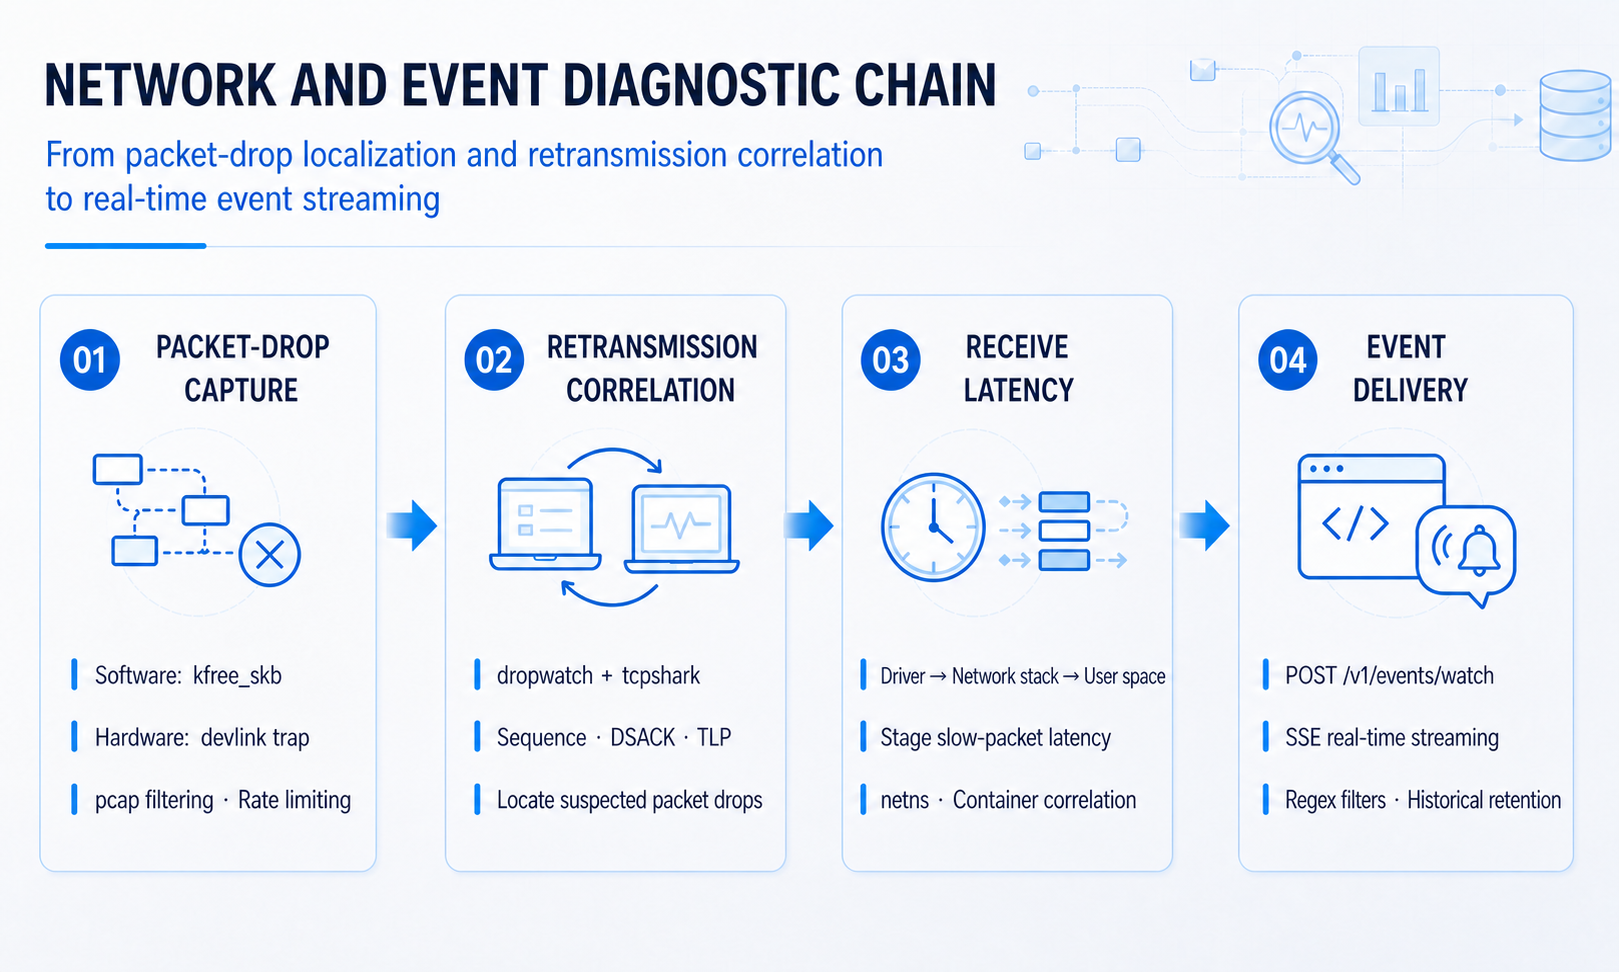
The new standalone dropwatch tool extends the Agent’s built-in packet-drop events into an on-demand diagnostic capability:
- Supports tcpdump-style pcap expressions for early packet filtering in BPF.
- Supports network interface inclusion, exclusion, and regular-expression matching.
- Enforces event rate limits to prevent packet-drop storms from overwhelming the output path.
- Parses protocols, five-tuples, kernel call stacks, and drop reasons.
- Correlates containers through memcg and netns identifiers.
- Writes to the terminal or sends events to the Agent through toolstream for persistence.
The pcap filter is implemented in pure Go and does not depend on libpcap or cgo.
dropwatch can also collect NIC ASIC packet drops through devlink_trap_report and include them in the unified event model:
source=hardware|softwaredistinguishes hardware drops from network stack drops.- Events include the trap name and trap group.
- Reports for the same skb are deduplicated within a time window if the skb later reaches kfree_skb after a hardware report.
2.2 TCP Retransmissions and Packet-Drop Correlation
The new tcpshark tool and tcp_retransmit event capture data retransmissions, SYN-ACK retransmissions, and optional Tail Loss Probes. Each event includes the connection four-tuple, sequence-number range, congestion state, retransmission count, reordering and DSACK context, and a classified retransmission cause.
Within a time window, dropwatch correlates packet drops with retransmissions by skb address or connection four-tuple and records the suspected drop location. tcpshark also supports pcap expressions and event rate limits.
2.3 Network Receive Latency
net_rx_latency adds the following capabilities:
- Supports skb timestamp layouts in Linux 5.15, Linux 6.8, and related distribution backports.
- Covers TCP receive paths for connections not in the ESTABLISHED state.
- Adds a network namespace cookie and aligns field names with dropwatch.
- Reports slow-packet latency in three stages: driver to network stack, network stack processing, and copying to user space.
2.4 Real-Time Event Subscriptions
The Agent now provides POST /v1/events/watch to continuously stream kernel events through Server-Sent Events. Subscribers can apply regular-expression filters for tracer, host, region, container hostname, container namespace, and container QoS. Multiple filters use AND semantics.
The server limits connection counts, sends heartbeats, and isolates slow clients. Events continue to be written to configured persistent backends; real-time subscriptions do not replace historical retention.
3. Metrics and AutoTracing
3.1 Ascend NPU Metrics
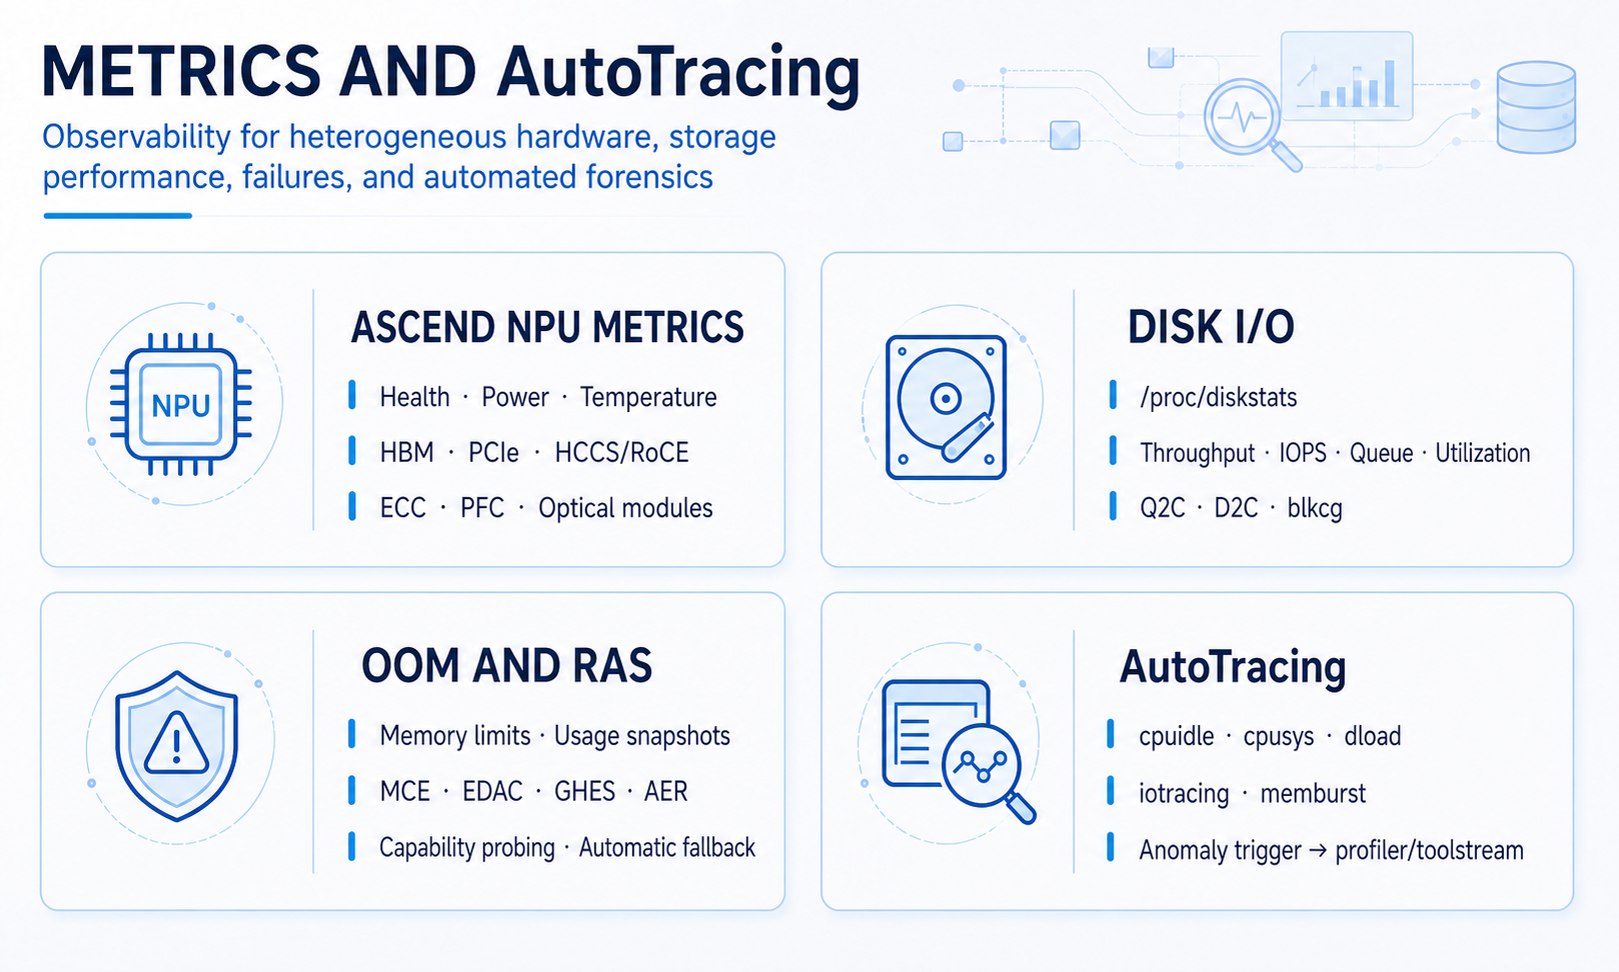
The new ascend_npu collector uses DCMI, HCCN utilities, and PCIe sysfs entries to collect:
- Device health, power consumption, temperature, and voltage.
- Utilization and frequency for AI Cores, Vector Cores, AI CPUs, and Ctrl CPUs.
- HBM capacity, utilization, temperature, bandwidth, and ECC errors.
- Current and supported PCIe link speeds and link widths.
- HCCS and RoCE port status, throughput, errors, retransmissions, out-of-order packets, CNP, and PFC.
- Optical module temperature, voltage, optical power, bias current, LOS, and SNR.
If a dynamic library or device capability is unavailable, the collector skips the corresponding metrics without affecting other collectors.
3.2 Disk I/O Metrics
This release adds a basic disk I/O collector and eBPF latency metrics:
- Device metrics from
/proc/diskstats, including throughput, IOPS, queue depth, and utilization. - Separate latency measurements from request queueing to completion (Q2C) and dispatch to completion (D2C).
- Metrics at both the block-device and container blkcg levels.
3.3 OOM and Hardware Errors
- OOM events now include memory limits, current usage, and system or container memory snapshots, providing the triggering process, the victim process, and memory pressure at the time of failure.
- RAS adds support for ARM GHES processor errors and provides consistent structured output for MCE, EDAC, ACPI GHES, and PCIe AER events.
- Required tracepoints are probed before RAS BPF starts; the collector falls back automatically when they are unavailable on minimal kernel builds.
- Network interface configuration supports lists of regular expressions.
- CPU metrics add an external wait ratio based on wait_sum.
- At startup, collectors check required procfs and custom memcg interfaces. A missing capability no longer causes an entire metric group to fail.
3.4 AutoTracing
v2.3.0 improves the existing cpuidle, cpusys, dload, iotracing, and memburst AutoTracing capabilities:
- cpuidle supports container filtering to prevent collection from being triggered by system components or workloads outside the target scope.
- Known-issue rules now support a composable IssuesList instead of a single pattern.
- CPU trigger conditions consistently support absolute and delta thresholds, reducing false triggers under steady high load.
- iotracing strictly enforces process-count and per-process file-count limits.
- AutoTracing results flow through the unified profiler/toolstream storage pipeline.
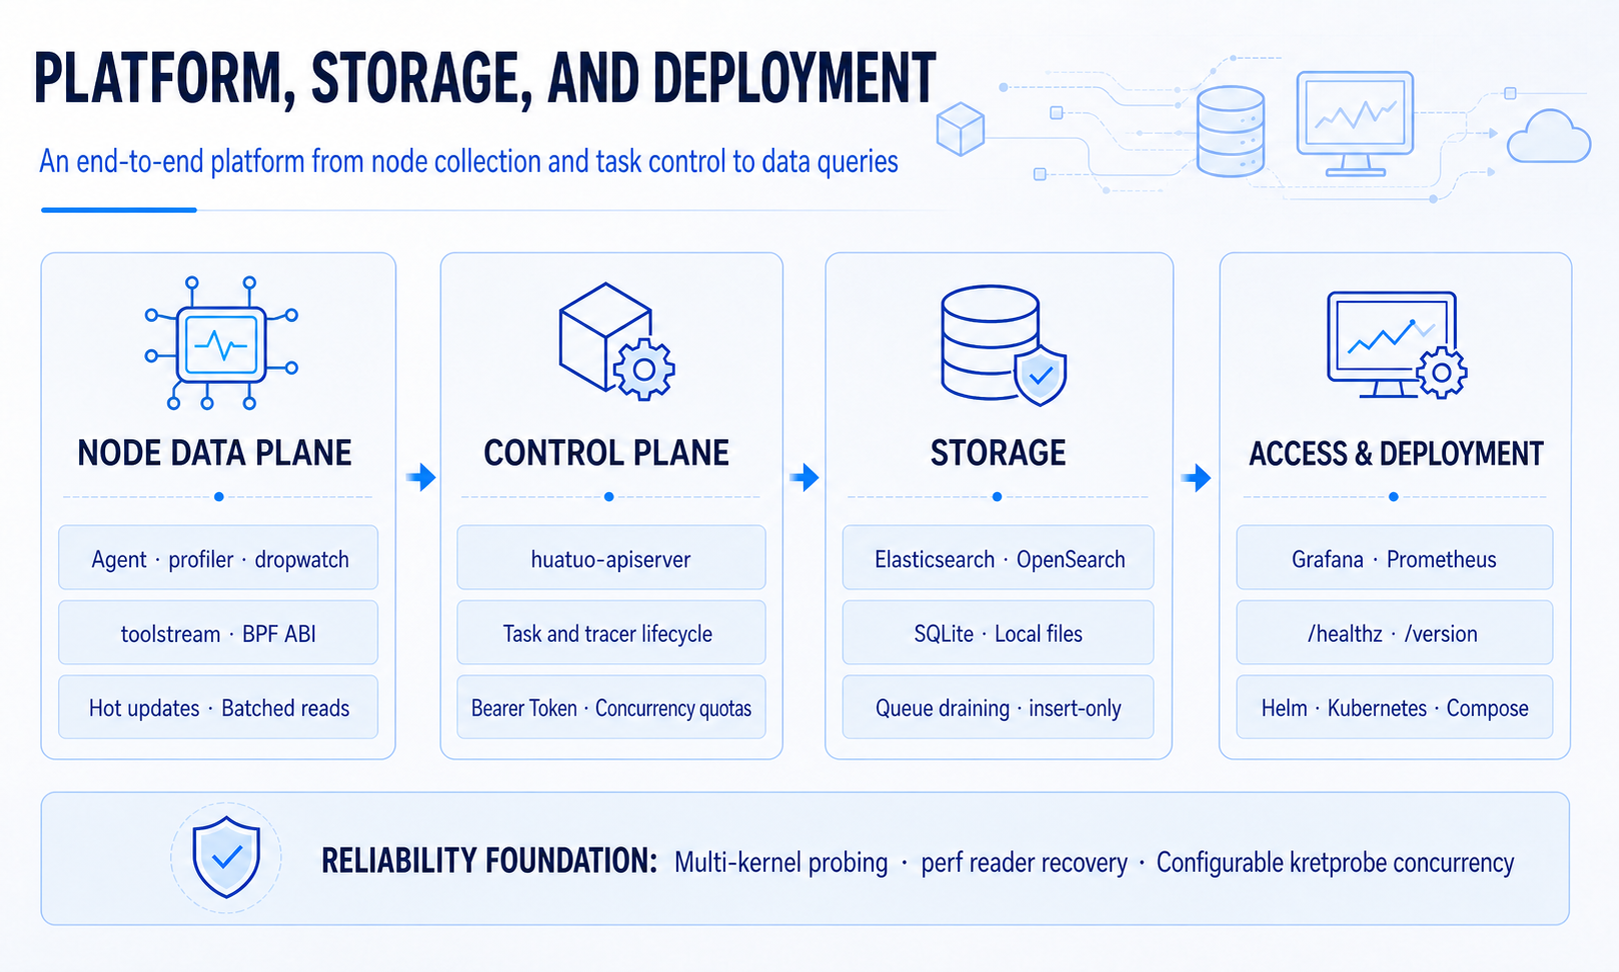
4. Platform, Storage, and Deployment
4.1 Control Endpoints
This release adds endpoints for creating, listing, querying, and stopping node tasks, as well as endpoints for listing, starting, stopping, and updating tracer configurations. All major binaries now provide consistent version output; HTTP services provide /healthz and /version; and the API Server adds request metrics and a debug logging option.
4.2 Storage Backends
The storage layer now uses a driver registration model. This release adds or improves:
- Backends compatible with Elasticsearch 7/8 and OpenSearch.
- A separate rotating local data log for each tracer.
- A SQLite backend that persists API Server task state.
- Simultaneous writes of tracing events to local files and configured remote backends.
- Draining asynchronous write queues before shutdown to prevent data loss during graceful shutdown.
- Insert-only writes to prevent records with the same ID from being silently overwritten.
4.3 Kubernetes, Development Environments, and Visualization
- A new Helm chart supports ConfigMap, DaemonSet, resource, hostPath, nodeSelector, and toleration configuration.
- The DaemonSet includes Prometheus scrape annotations.
- The Prometheus example includes Kubernetes service discovery and relabeling.
- The Docker Compose setup includes a development environment and service health checks.
- The documentation provides baseline production resource requests and limits, along with Helm upgrade and rollback procedures.
- The Agent’s own cgroup limits now require explicit enablement to avoid conflicts with the Kubernetes Pod cgroup lifecycle.
This release adds continuous profiling dashboards for hosts and containers and a disk I/O dashboard, and updates the host, container, and AutoTracing dashboards. The full Compose environment includes Elasticsearch, Prometheus, Grafana, and the profiling query pipeline, allowing users to validate the complete diagnostic workflow from metrics and events to flame graphs.
4.4 Reliability and Compatibility
- toolstream: A typed event channel based on Unix sockets that carries output from dropwatch, iotracing, and profiler subprocesses.
- BPF ABI: C header files are the single source of truth for generated Go structs and enums, preventing layout mismatches between BPF and user space.
- Lifecycle: Hardened BPF object hot-update and read paths prevent metric collection loops from accessing closed objects.
- Compatibility: Additional detection paths cover ARM GHES, folios, skb timestamps, and tracefs kprobe symbols across kernel versions.
- Diagnostics: BPF debug output now includes source files, line numbers, and wall-clock timestamps.
- Performance and reliability: Improvements include batched CPU event reads, continued operation of perf readers after sample loss, configurable kretprobe concurrency, and fewer allocations in BPF hot paths.
5. Recommended Post-Upgrade Checks
- Access
/healthzand/versionon the Agent and API Server to confirm that the services are healthy and their versions match. - Call
/v1/profiles/capabilitiesto identify the profiling modes supported by the dependencies available on each node. - Validate dropwatch and tcpshark pcap filters and event rate limits against non-production traffic.
- Select Elasticsearch, OpenSearch, or local-file storage as appropriate for the environment. Verify that write queues drain before shutdown and that the API Server’s SQLite task database is stored in a persistent directory.
- Use version-pinned images for Kubernetes deployments and configure resource requests and limits as documented. Do not use latest in production.