
Building Kernel Observability for AI Agent Sandboxes
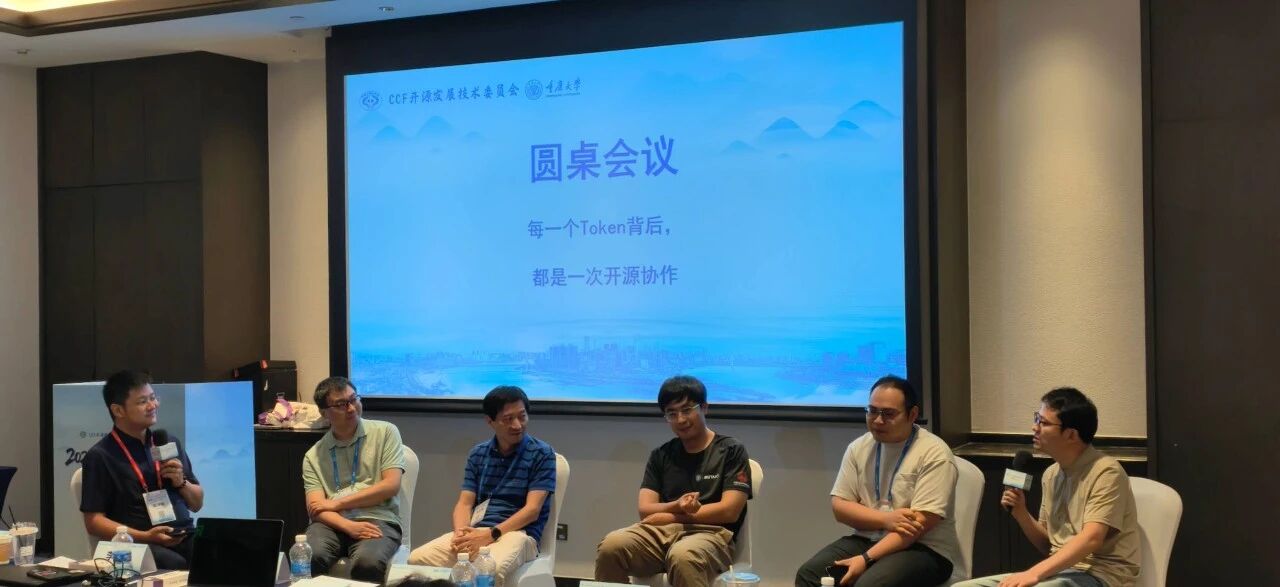
Recently, the CCF China Open Source Conference (CCF ChinaOSC) opened at the Chongqing Shancheng International Convention Center. Under the conference theme of “渝见开源,数智启新” (“Meet open source, ignite digital intelligence”), the event delivered technical insights on frontier topics such as ubiquitous operating systems, embodied intelligence, and open-source supply-chain security.
At the conference, Zhang Tonghao, lead of the open-source HUATUO project at Didi, presented Full-Stack Kernel Observability for Agent Sandboxes, sharing HUATUO’s work on kernel observation, anomaly capture, and performance analysis. This article starts from the observability challenges of the AI era and explains how HUATUO builds full-stack kernel observability for agent sandboxes.
Project repository: https://github.com/ccfos/huatuo
Project website: https://huatuo.tech/

Background and Challenges
Cloud-Native Era
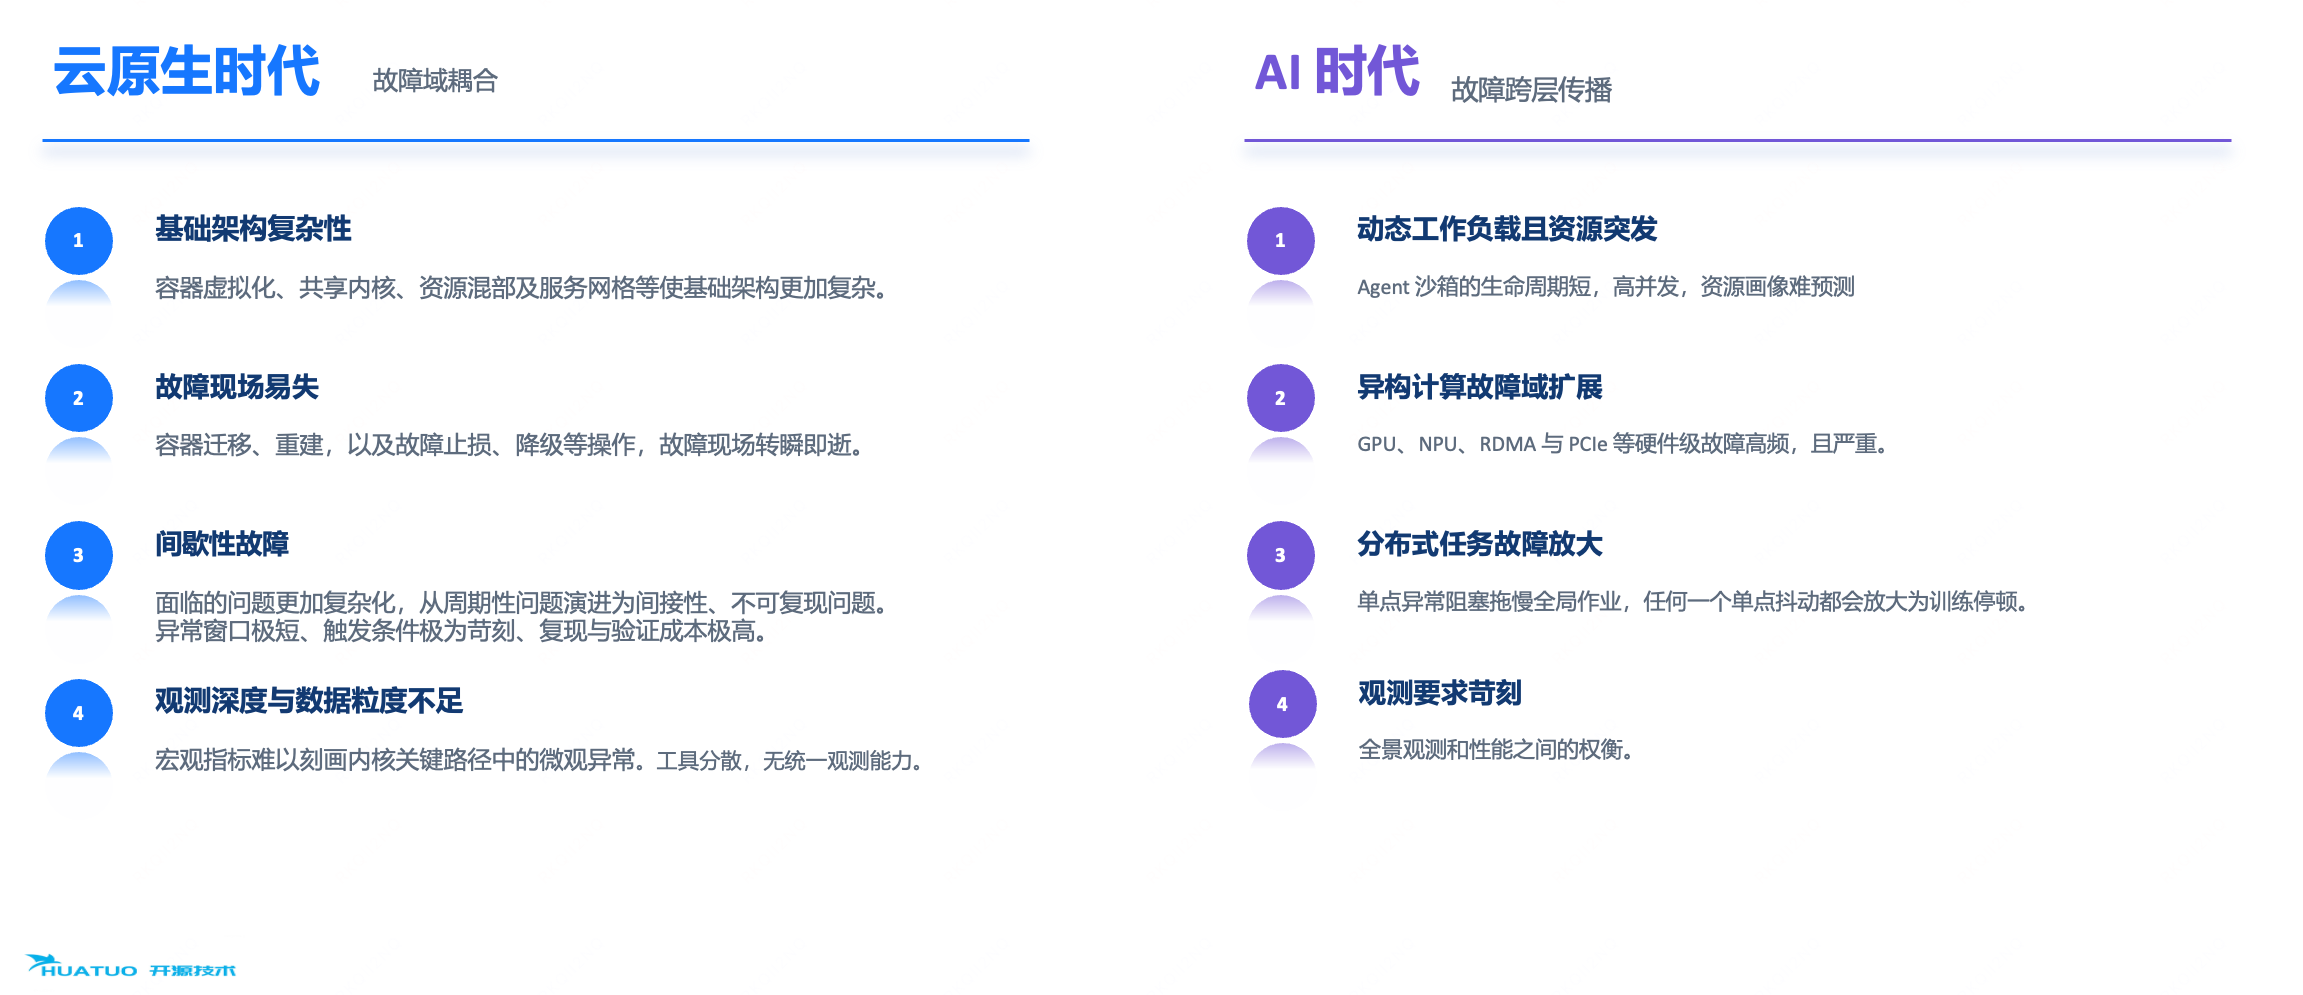
- Container virtualization, shared kernels, resource co-location, and service mesh increase infrastructure complexity, which in turn makes system fault localization harder.
- In production, when a problem occurs, services often have to be degraded, scaled down, migrated, or rebuilt. These actions erase the failure scene. Offline reproduction, on the other hand, is expensive and often fails; even when it succeeds, there is no guarantee that the reproduced root cause matches production.
- Moreover, the problems we face today are more complex. What used to be periodic, reproducible issues have evolved into intermittent, non-reproducible ones with very short symptom windows and strict trigger conditions.
- Most importantly, when these business pains emerged, the industry had no effective tool for observing microscopic kernel anomalies.
AI Era
The AI era brings additional challenges. Agent sandbox workloads are highly concurrent and bursty, and their resource profiles are difficult to predict. In AI training, hardware has become a critical resource: any single hardware anomaly can slow down the entire training job or even abort it.
Solution
What is our approach to these challenges? Before failures can be analyzed, the system must be observable, the scene must be traceable, and the failure must be analyzable.
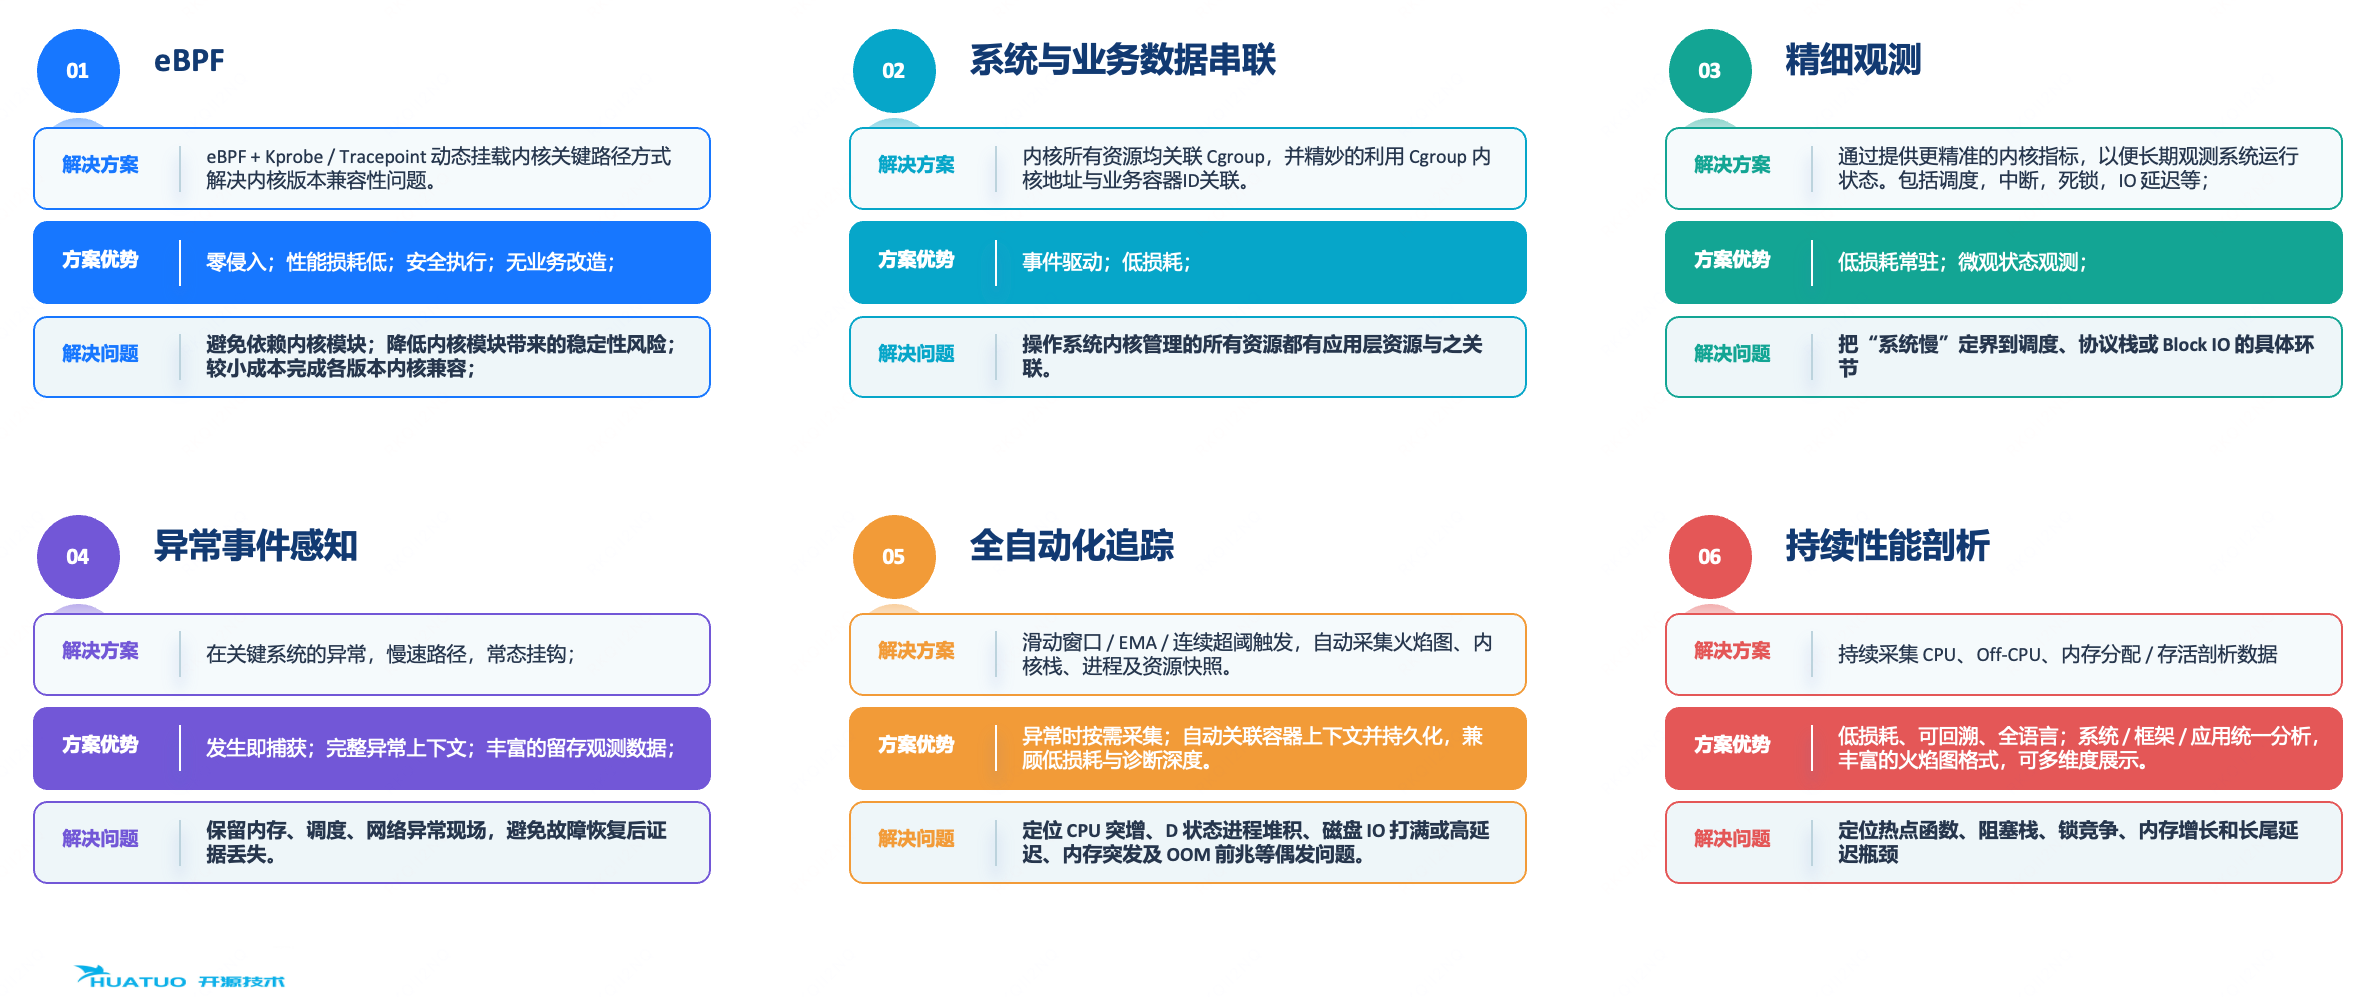
- How do we solve kernel version compatibility and stability? eBPF makes the kernel programmable and allows user-defined code to run safely. With eBPF, problem analysis no longer depends on traditional kernel modules. Combined with kernel dynamic tracing, eBPF provides non-intrusive, low-overhead, and safe observation probes.
- How do we correlate system data with business data? System-level and application-level data are naturally isolated, but true fault localization requires connecting them. HUATUO observes cgroup creation events in the kernel, associates each container ID with its kernel cgroup address, and tags every kernel event with that address. The final correlation is resolved in userspace.
- How do we achieve system-level observability? The HUATUO project combines kprobe, tracepoint, ftrace, perf events, and eBPF to collect metrics, events, and call stacks from the host kernel without modifying business code. These capabilities are organized into five layers:
- Kernel-wide metrics: fine-grained kernel metric collection with eBPF, narrowing “system slowness” down to specific subsystems such as scheduling, the network protocol stack, or block I/O.
- Anomaly event awareness: probes on key abnormal and slow paths that preserve memory, scheduling, and network evidence before it is lost after recovery.
- AutoTracing: fully automatic tracing that uses sliding windows and threshold triggers to capture flame graphs, kernel stacks, and process and file snapshots, balancing low overhead with deep observability.
- Continuous profiling: adds a time dimension to conventional flame graphs so hotspots can be traced back across history, addressing performance jitter.
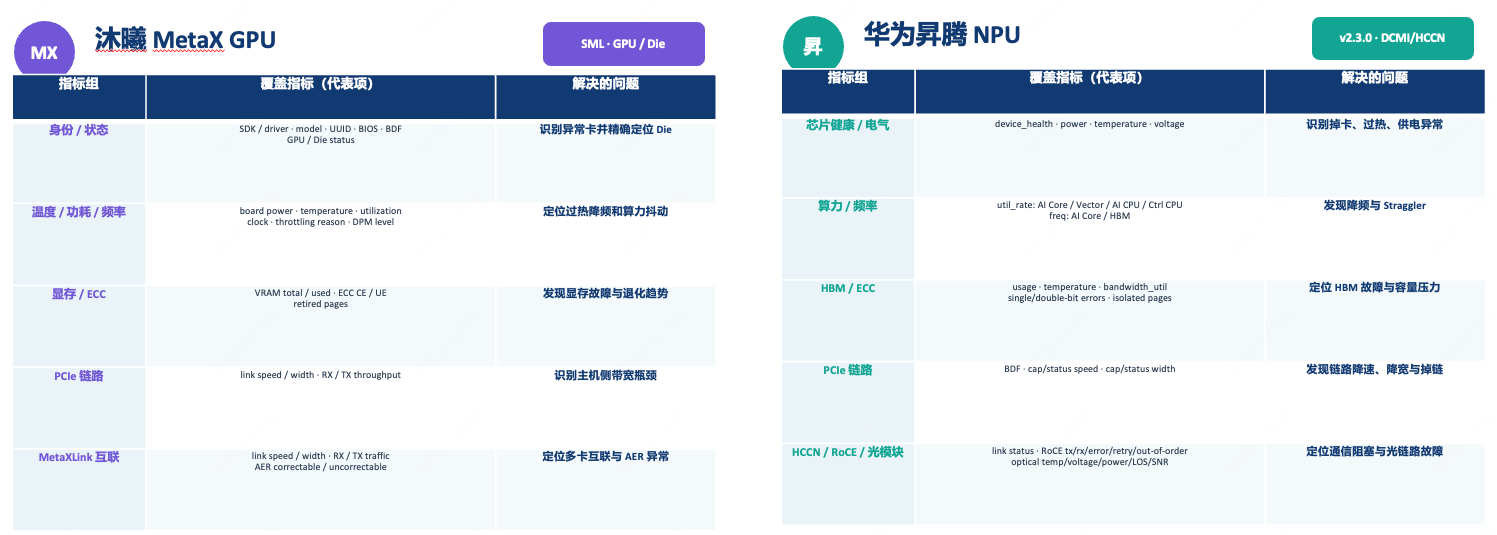
- Heterogeneous hardware awareness: failure detection for AI hardware (ECC, AER, PCIe, GPU/NPU, RoCE, etc.), improving effective AI training time.
Full-Stack Observability Foundation
With the top-level design in place, concrete observability capabilities are needed. This is what the full-stack observability foundation delivers.
Full-Stack Observability with End-to-End Coverage
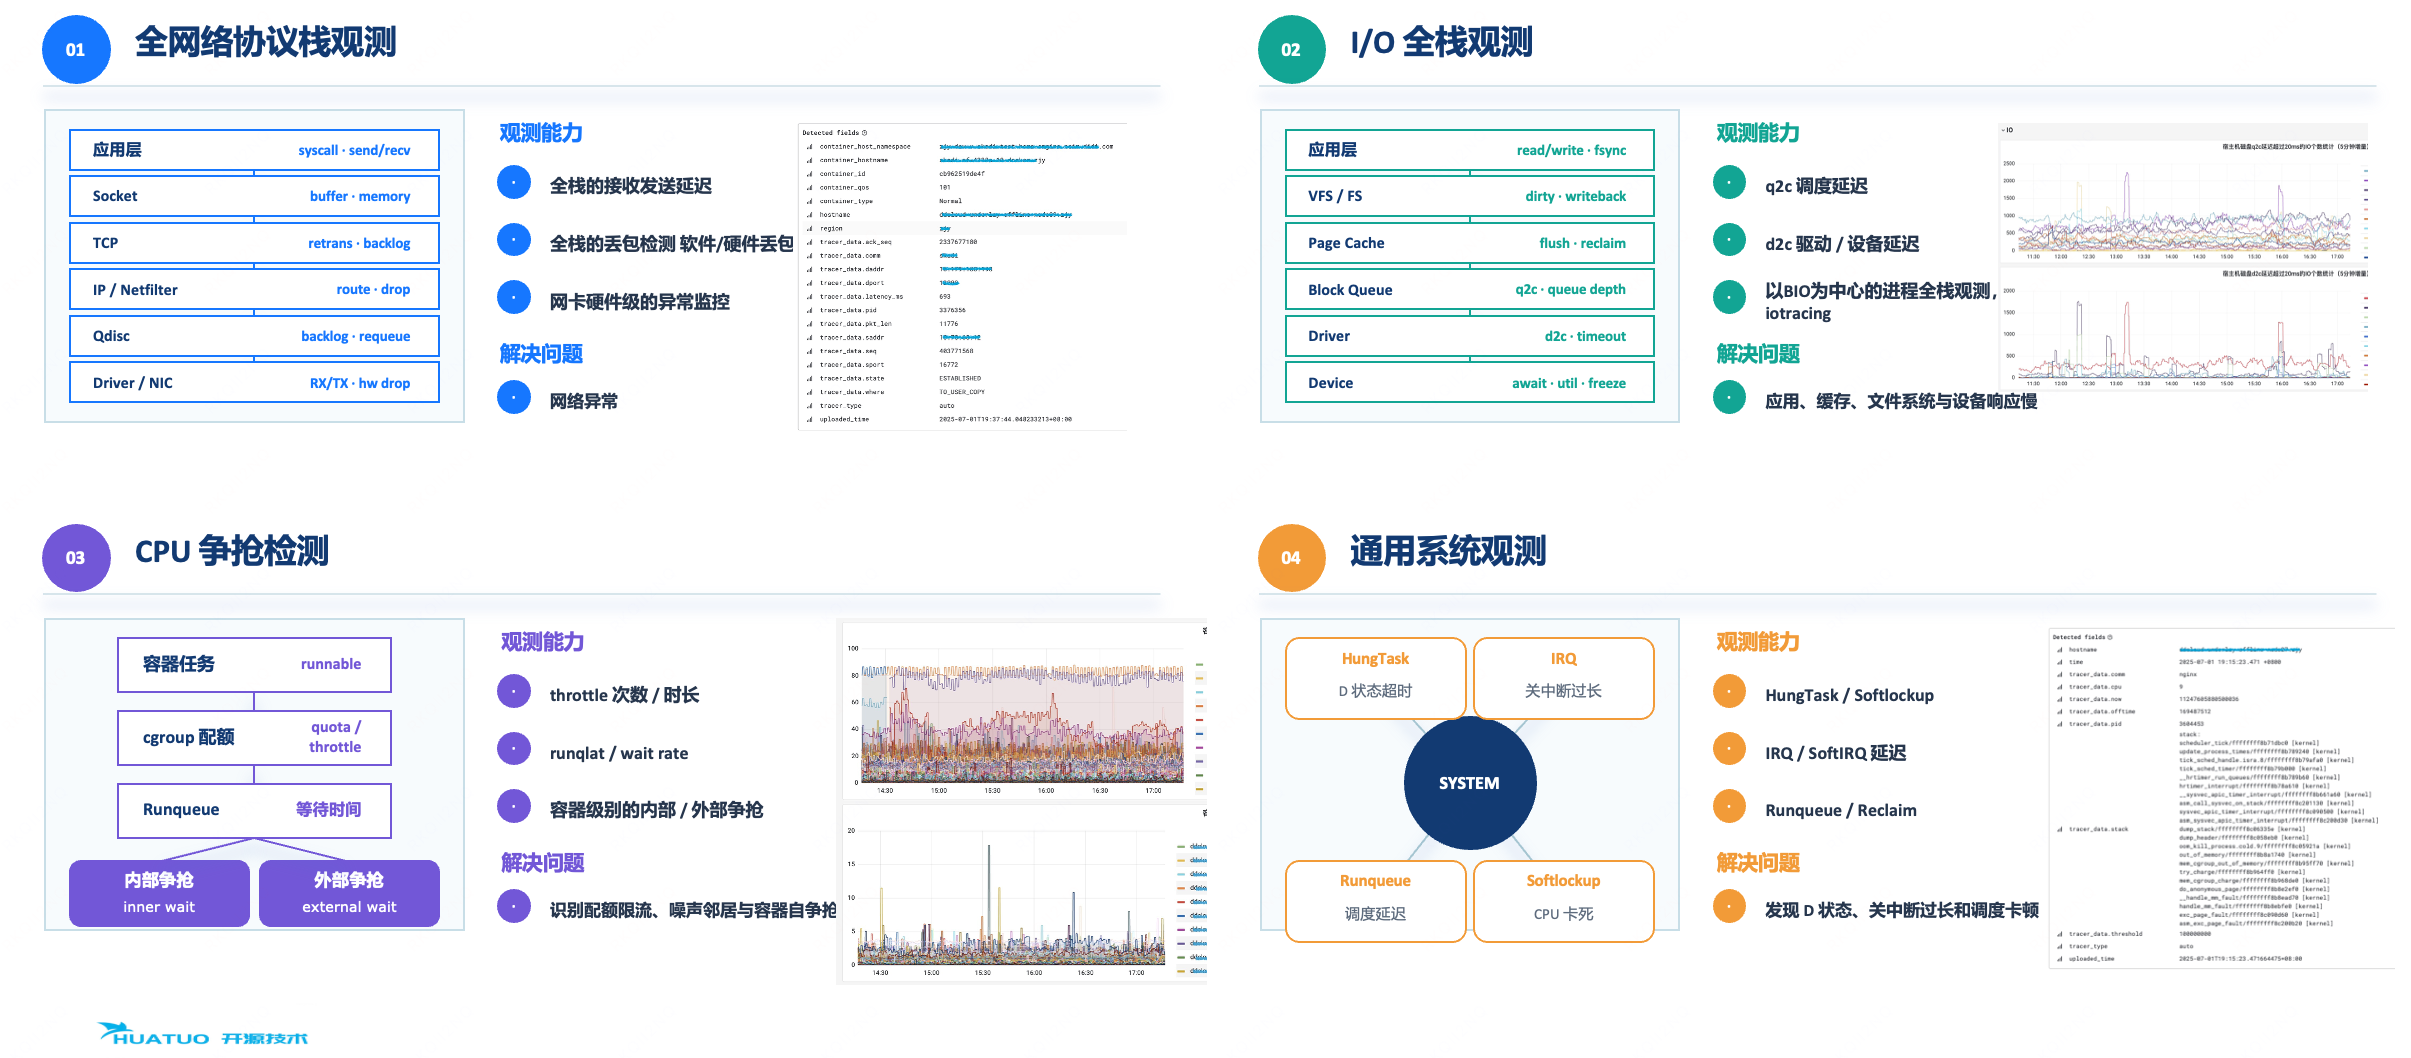
- Full network protocol-stack observability: end-to-end coverage from physical links, drivers, and the protocol stack to userspace, including RX/TX latency, hardware- and software-level packet drop detection, retransmission, and TCP queue state.
- Full-stack I/O observability: inode-centric, end-to-end tracing of the process-level I/O lifecycle across VFS, filesystem, page cache, block queue, and drivers down to physical devices. Rich context is correlated to locate the root cause of slow I/O.
- CPU contention detection: on dense sandbox nodes, CPU utilization alone cannot reflect resource contention. HUATUO focuses on both intra-container and external contention – especially important for agent sandboxes, where a task’s latency may come from its own concurrency or from “noisy neighbors”:
- Intra-container contention: threads in one container exceed the available CPUs;
- External contention: the container competes with other workloads on the node for the runqueue;
- Scheduling latency: a runnable task waits too long to acquire a CPU;
- General system observability: HungTask, softlockup, IRQ/softirq latency, and memory reclaim jointly cover system-level stalls. They expose transient anomalies that average utilization cannot describe, such as long interrupt-disabled windows on a CPU, accumulation of D-state tasks, or direct memory reclaim blocking in a container.
Capture Anomalies When They Occur, Rather Than Guessing Later
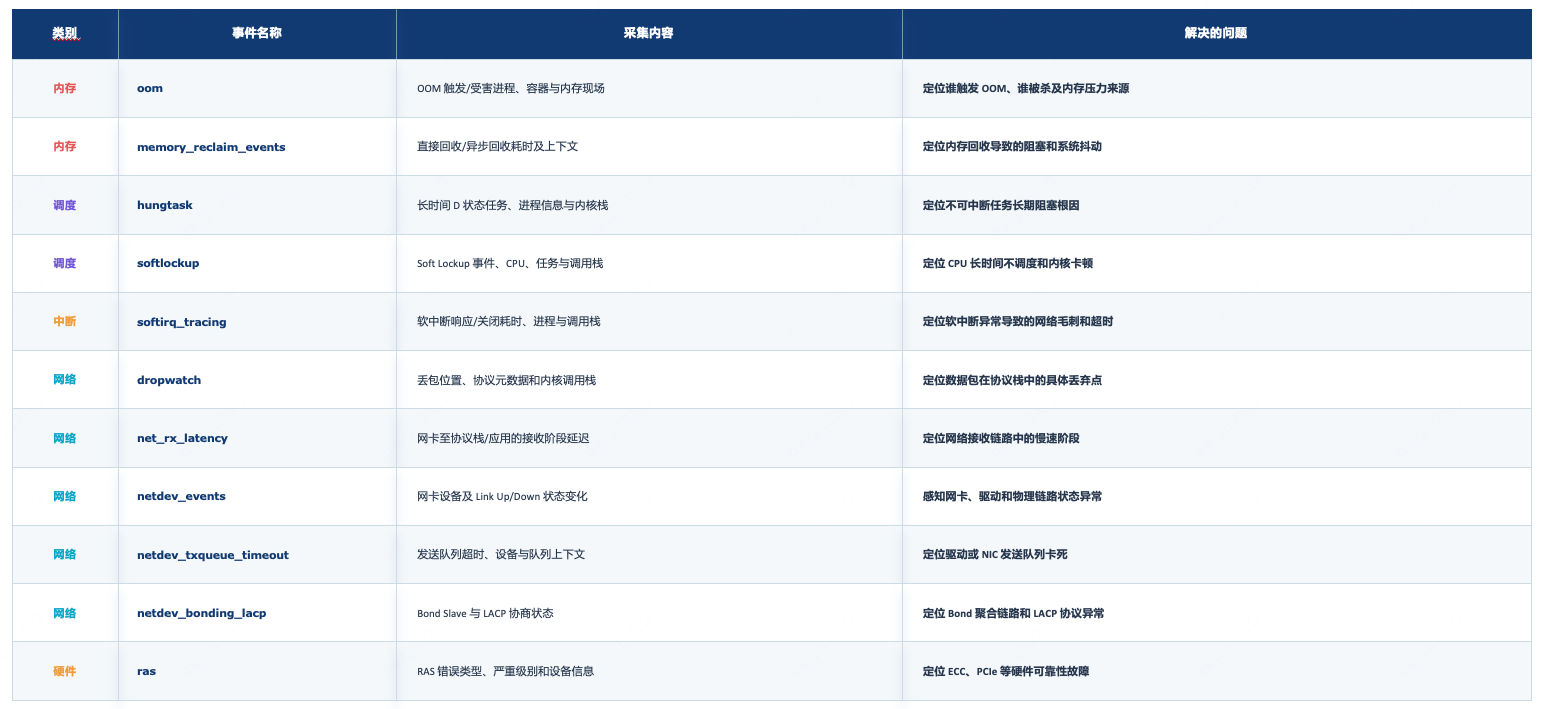
Metrics are suitable for observing trends; events are better for preserving anomaly scenes with clear boundaries. HUATUO attaches eBPF programs to abnormal and slow kernel paths. When an event fires, process, call stack, network, or hardware context is collected in the kernel and delivered to userspace through the perf event buffer, where it is filtered, correlated with containers, and persisted.
AutoTracing Automatically Captures Spikes
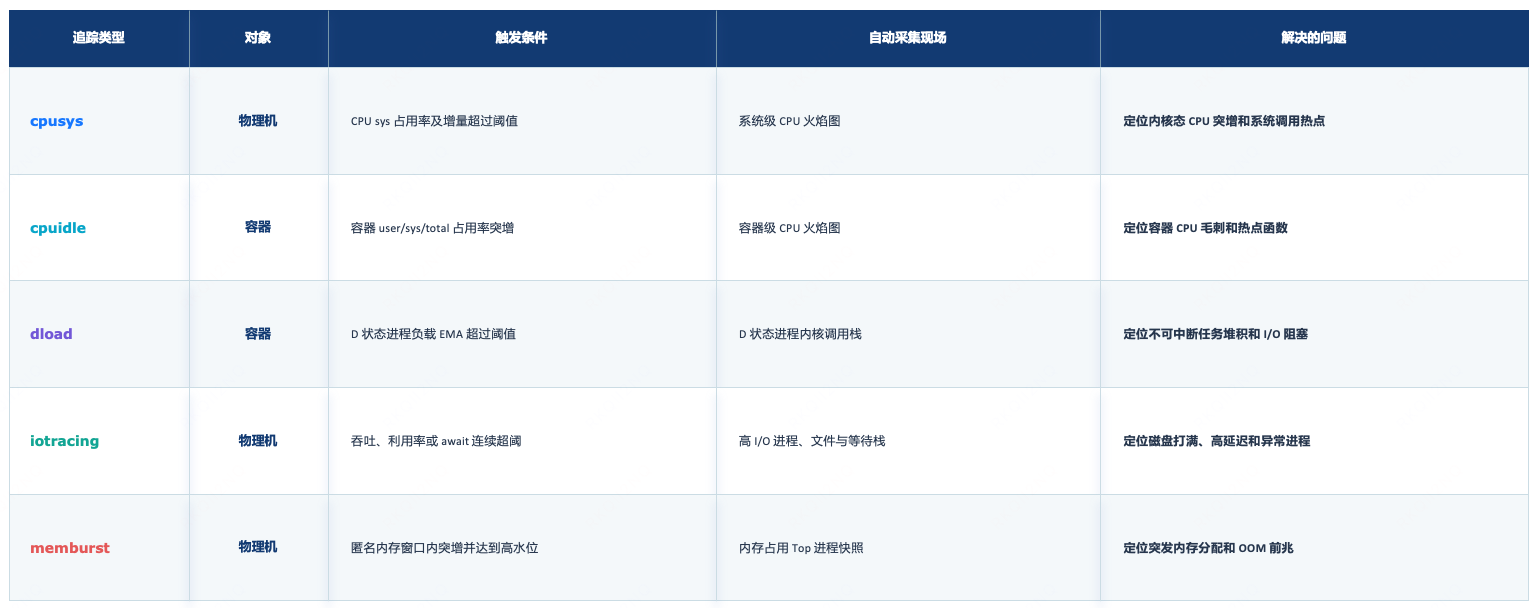
Many performance issues are neither clear kernel anomalies nor reproducible through average metrics – for example, a container CPU spike for ten seconds, continuous disk await jitter, or rapidly growing anonymous memory. By the time an engineer intervenes, the issue has already recovered.
AutoTracing continuously monitors the system for anomalies and detects them through sliding windows, EMA, incremental thresholds, or consecutive threshold violations. Thresholds are not immutable constants: the project ships production-tested defaults, but they should be calibrated against the baseline for different CPU quotas, disk media, and task densities.
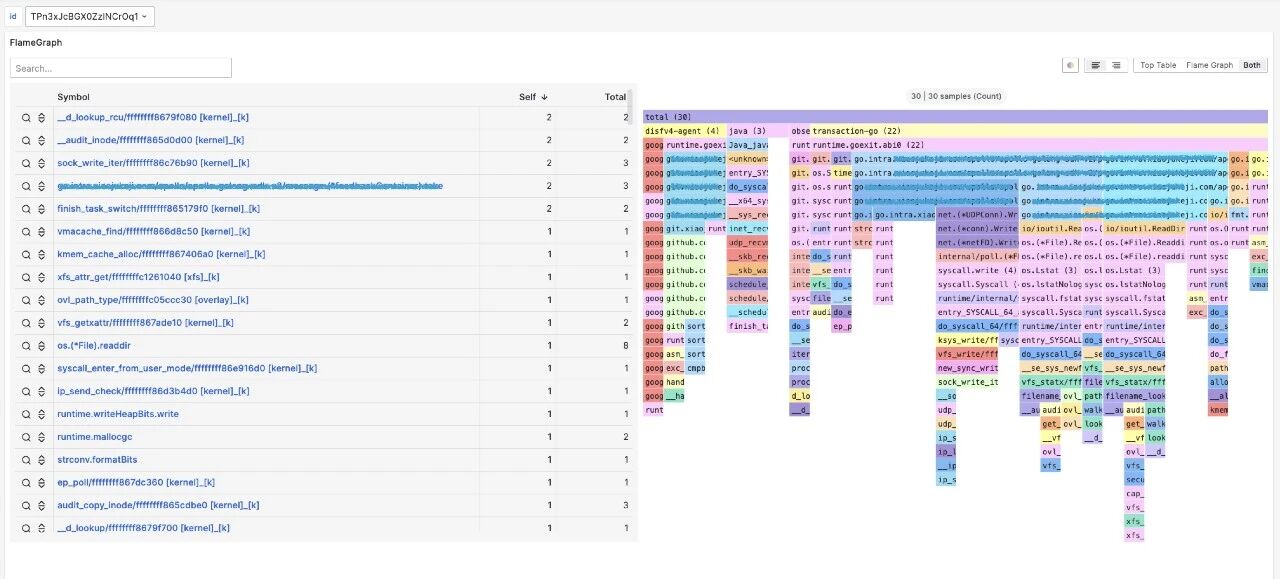
Flame graphs further translate “high CPU” into functions and call paths. The Top Table on the left is convenient for locating hot symbols, while the flame graph on the right is suitable for analyzing call relationships. On sandbox nodes, targets can be restricted to the corresponding VMM PID, thread group, or cgroup so that whole-machine aggregation does not hide the hotspots of an individual sandbox.
Continuous Profiling Keeps the Scene Replayable

AutoTracing captures the system at the moment an anomaly occurs; continuous profiling answers how a problem evolves over time. Conventional ad-hoc sampling aggregates all data into a single graph with no timeline. Continuous profiling retains results per window, turning intermittent slowdowns into searchable, comparable, and replayable historical scenes. HUATUO’s unified profiler currently covers:
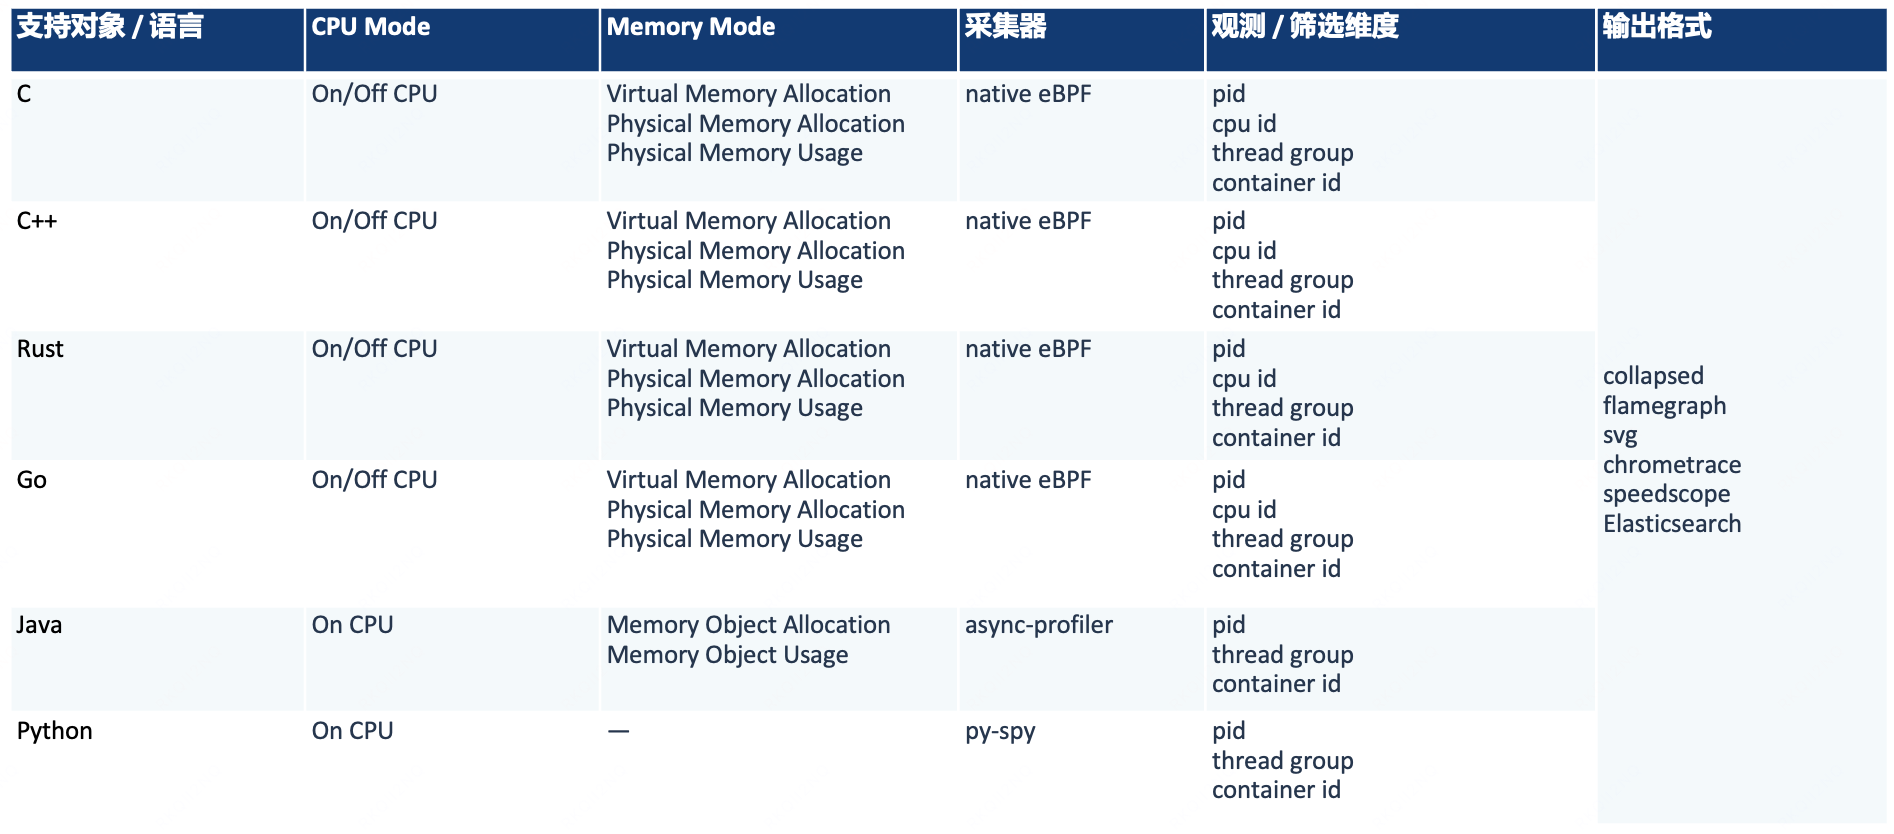
Off-CPU profiling is especially useful for “low CPU but slow requests.” It attributes the time a thread spends off the CPU to the call path at switch-out and distinguishes blocked waits from runqueue scheduling waits: the former points more often to I/O, locks, or condition variables, while the latter points more often to CPU contention.
Native memory profiling clarifies three concepts that are often conflated:
- virtual_alloc: how much virtual address space was requested;
- physical_alloc: how many physical pages were actually allocated during the window;
- physical_usage: how many physical pages remain resident at collection time.
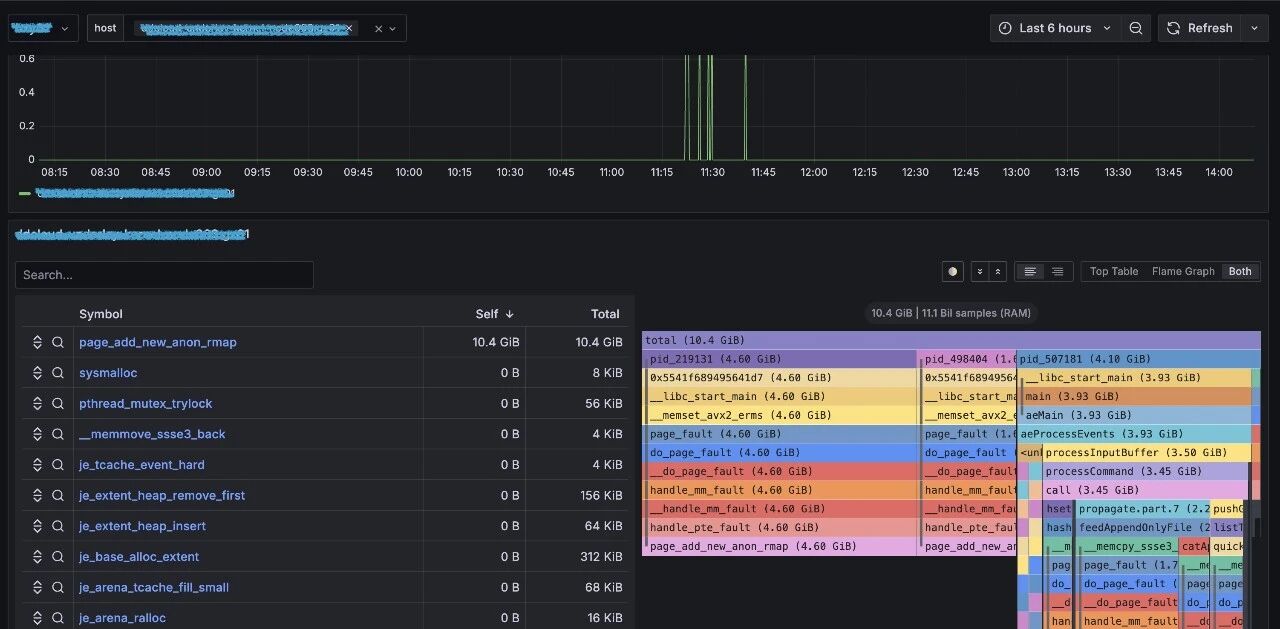
Figure: Physical memory residency aggregated by process and call path, allowing drill-down from “high node memory” to specific allocation paths.
On a single host, you can use the CLI directly:
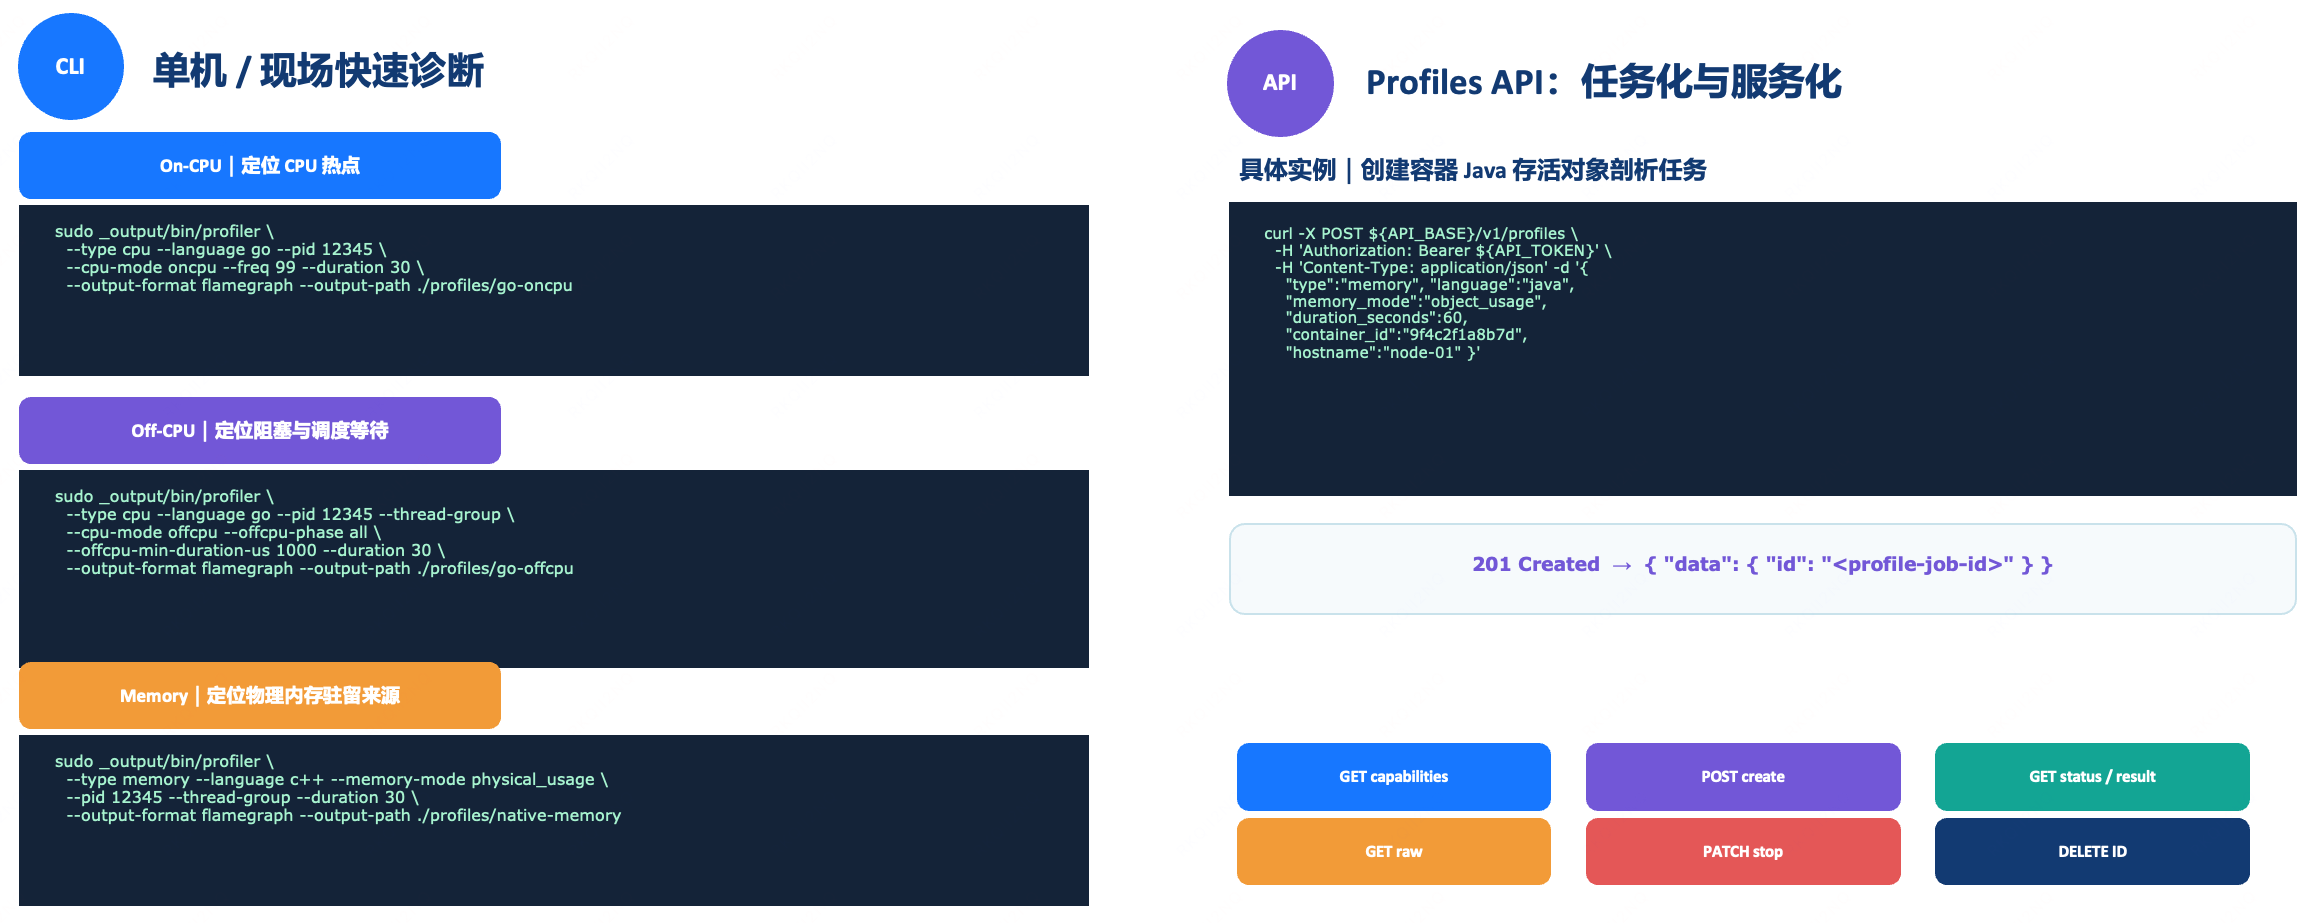
On the platform side (huatuo-apiserver), the Profiling API supports capability discovery, task creation, status and result queries, raw data retrieval, and task stop and deletion. In this way, ad-hoc commands evolve into service-oriented, task-based continuous profiling.
From RAS to GPU/NPU
In AI infrastructure, hardware problems do not always appear as a device going offline. Continuously rising correctable ECC errors, PCIe link width degradation, AER errors, GPU downclocking, or RoCE retries can first show up as throughput drops or tail latency.
HUATUO captures structured hardware events through the Linux RAS stack – MCE, EDAC, ACPI GHES, and PCIe AER – and feeds them into alerting and audit pipelines:
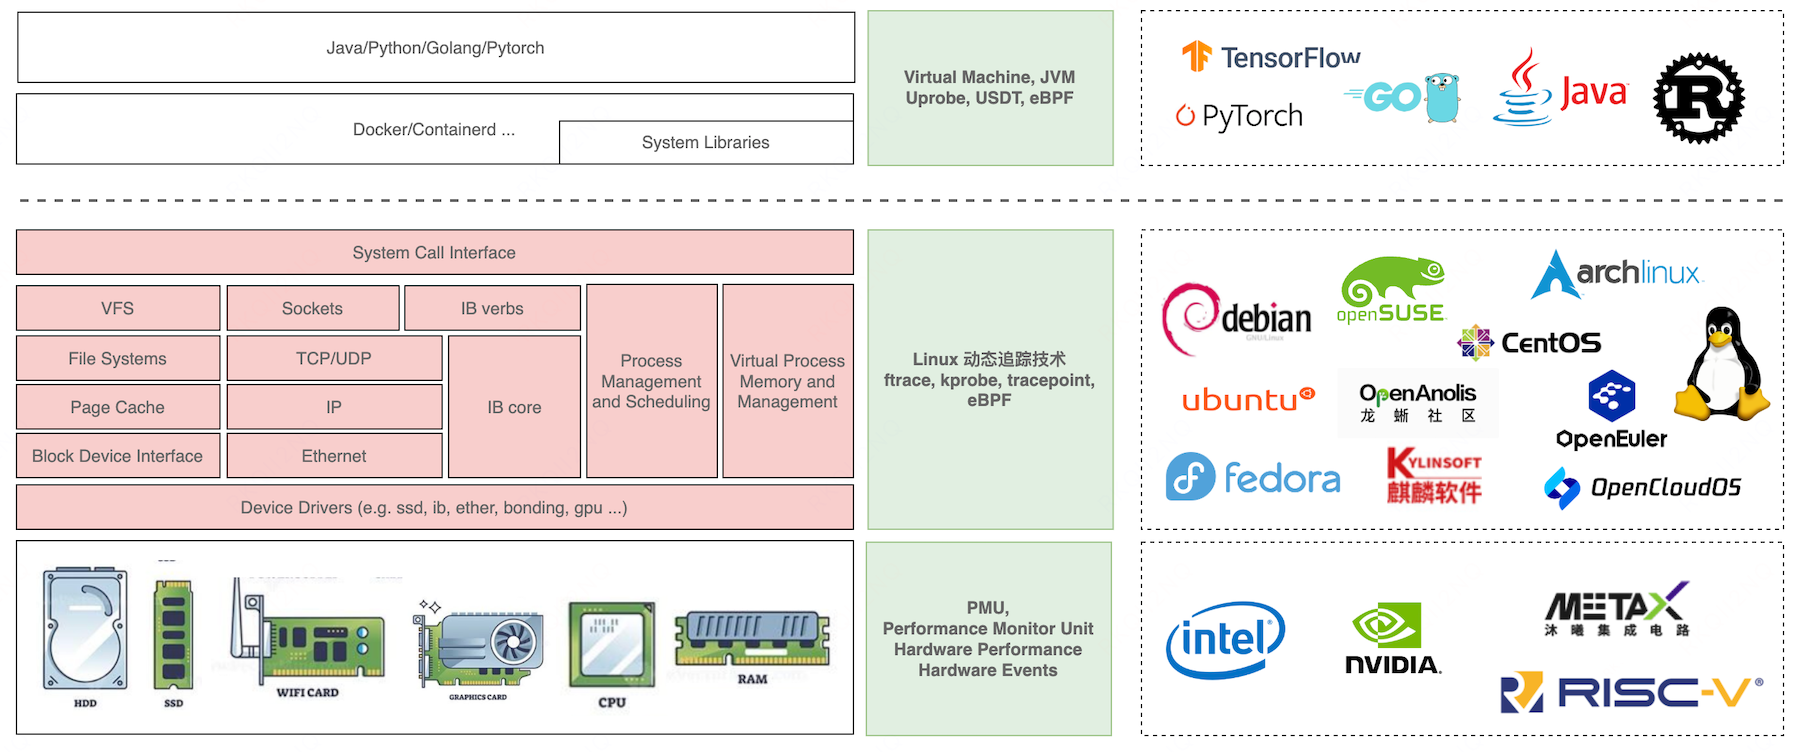
Figure 3: Hardware errors enter the kernel RAS subsystem from CPUs, memory, the platform, and PCIe devices.
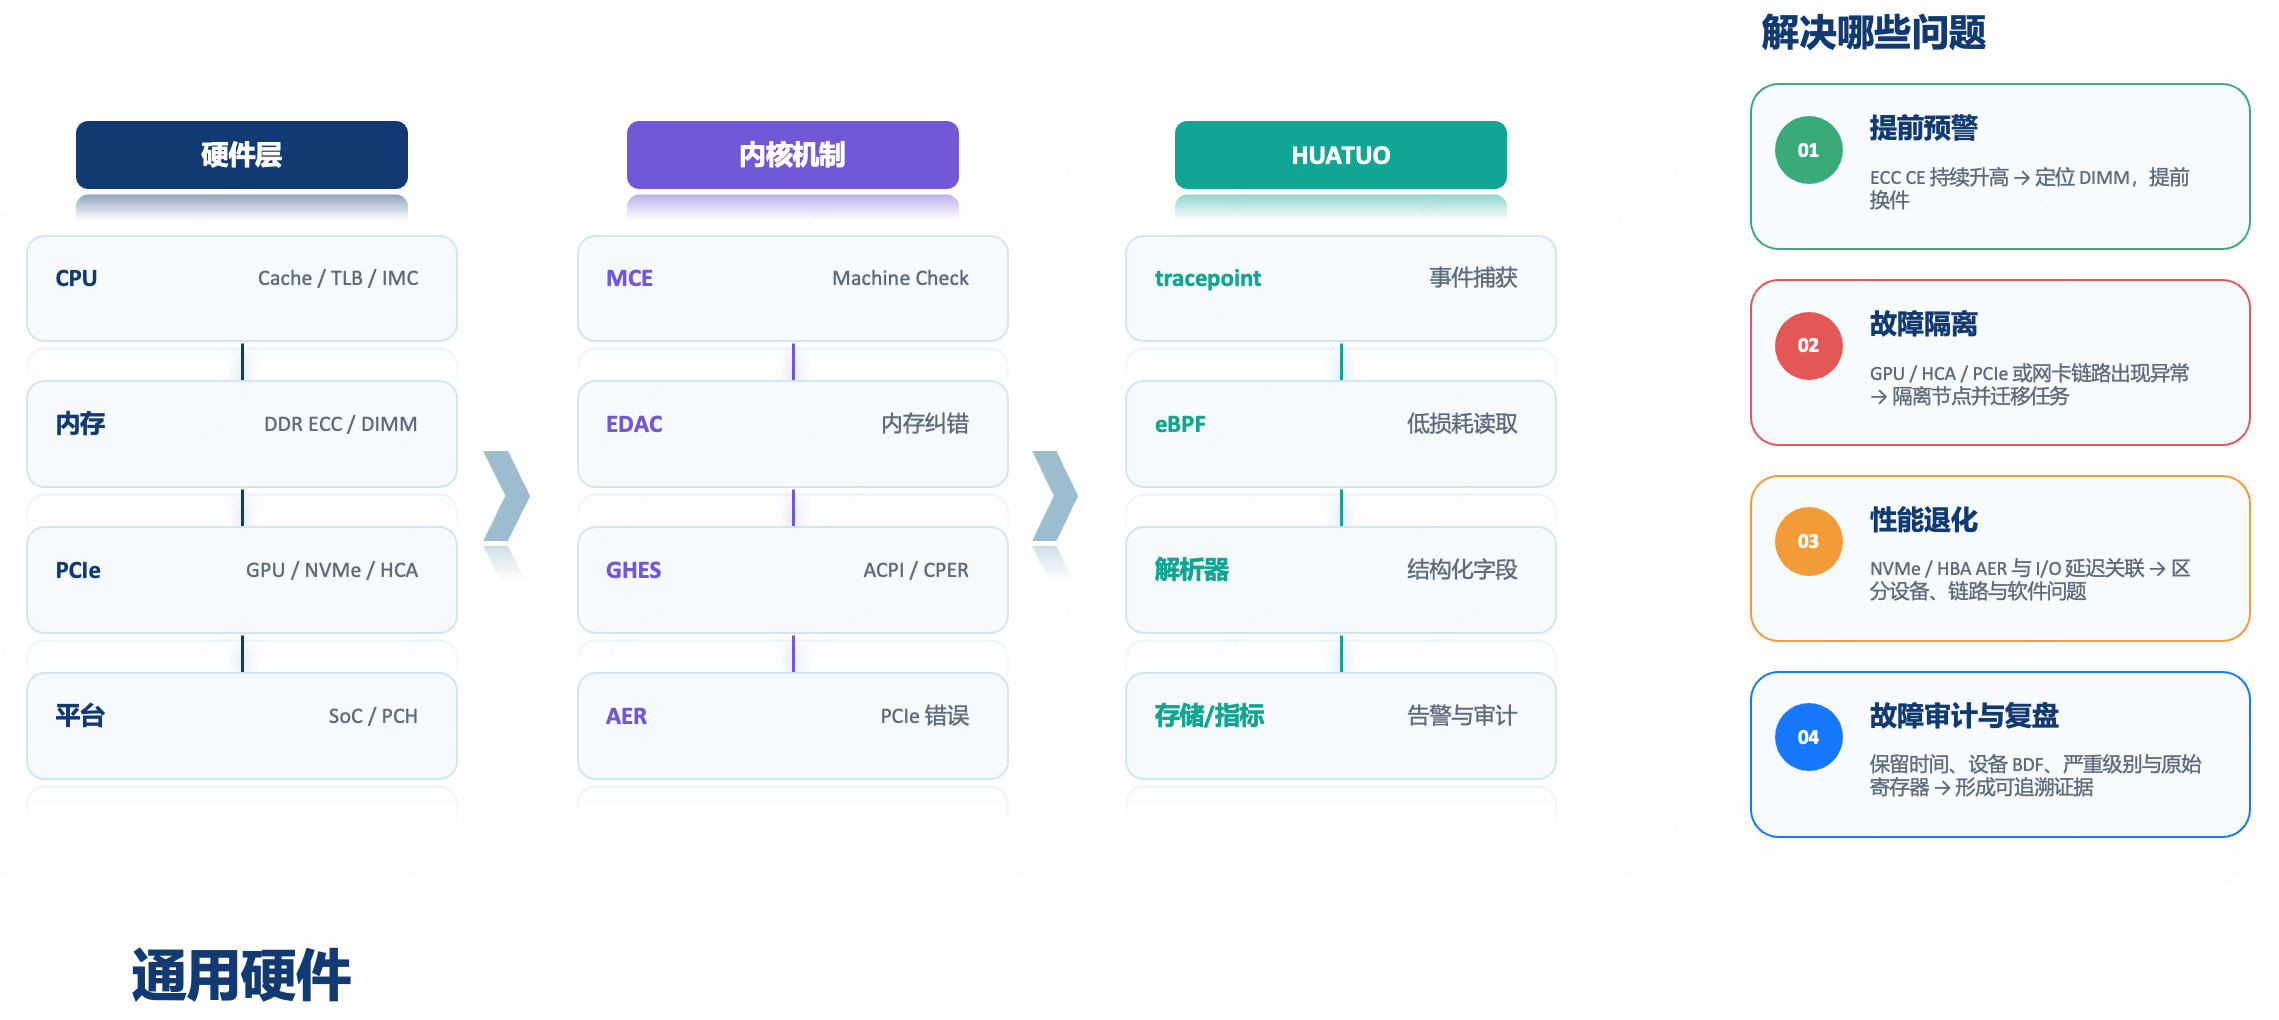
This capability mainly serves four goals:
- Early warning: proactively replace a DIMM when the ECC CE frequency on the same module keeps rising;
- Fault isolation: isolate nodes and migrate tasks when GPU, HCA, PCIe, or NIC links are abnormal;
- Performance degradation localization: correlate NVMe/HBA AER events with I/O latency to distinguish software, device, and link problems;
- Audit and review: retain timestamps, device BDF, severity levels, and raw fields as traceable evidence.
The key is not adding isolated hardware metrics, but correlating hardware events with scheduling, network, I/O, and profiling data in the same time window. Only then can the platform determine whether an agent stall comes from the software call path or from underlying device degradation.
Agent Sandbox Hierarchical Correlation
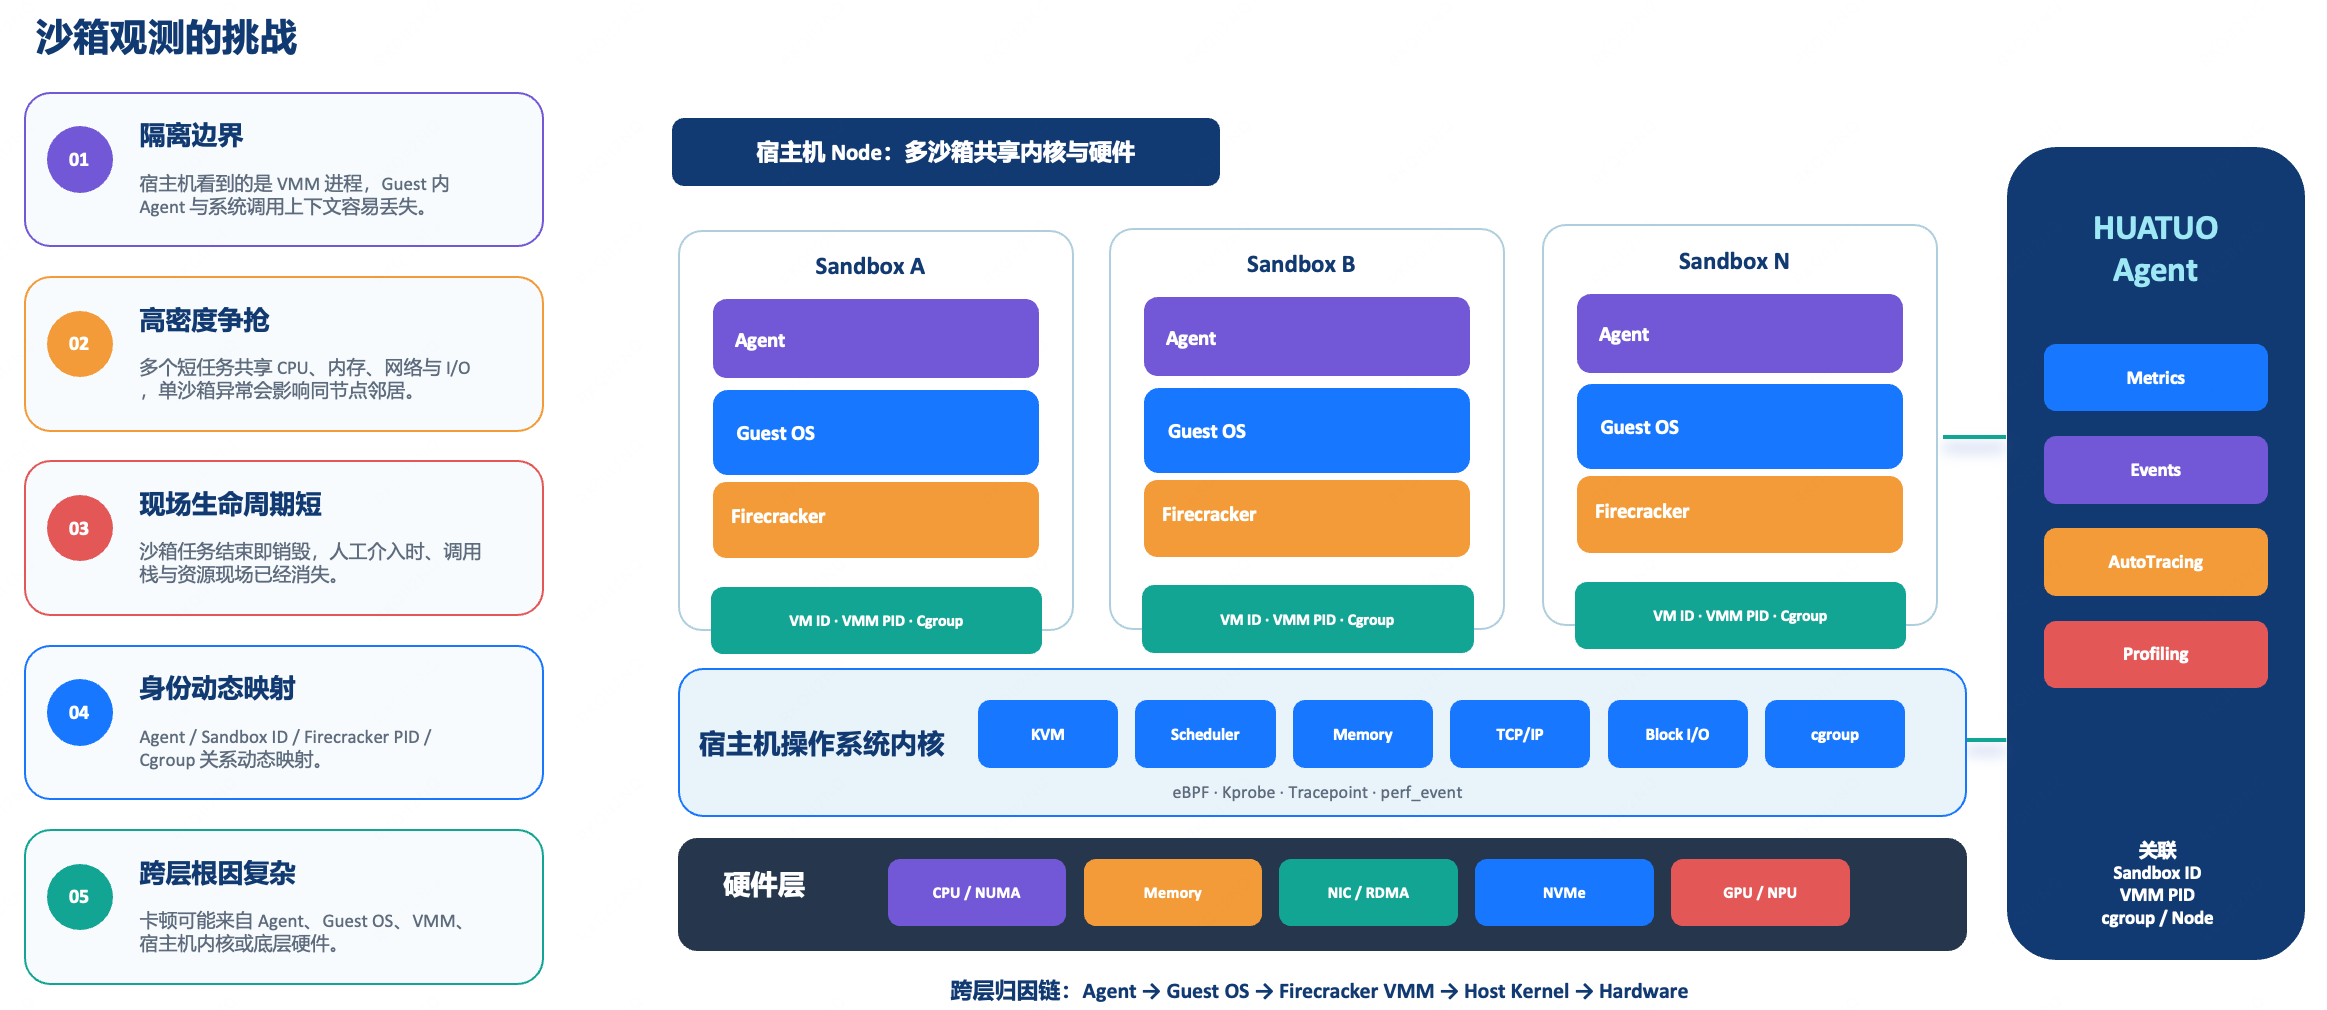
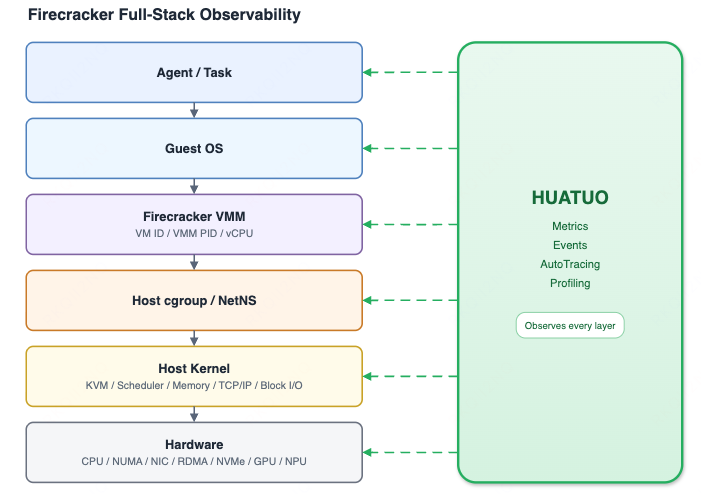
After probes collect kernel stacks, the remaining question is “whose scene is this?” Container environments can be correlated through cgroup CSS, network namespaces, and container runtime metadata. MicroVM sandboxes additionally require a mapping between the Sandbox and its VMM.
Community
HUATUO was open sourced by Didi in 2025 and is incubated within the China Computer Federation (CCF). Through continued development, the project has grown from internal practice at Didi into a broader open-source community.
As of August 2026, HUATUO has released v2.3.0 with approximately 1.1k GitHub stars, 51 contributors, and 1,310 commits, more than 15k image pulls, and deployments in over 20 enterprises. At the same time, MetaX and the Huawei Ascend community, among others, have been contributing GPU/NPU capabilities to HUATUO, helping the project expand further into AI infrastructure scenarios.
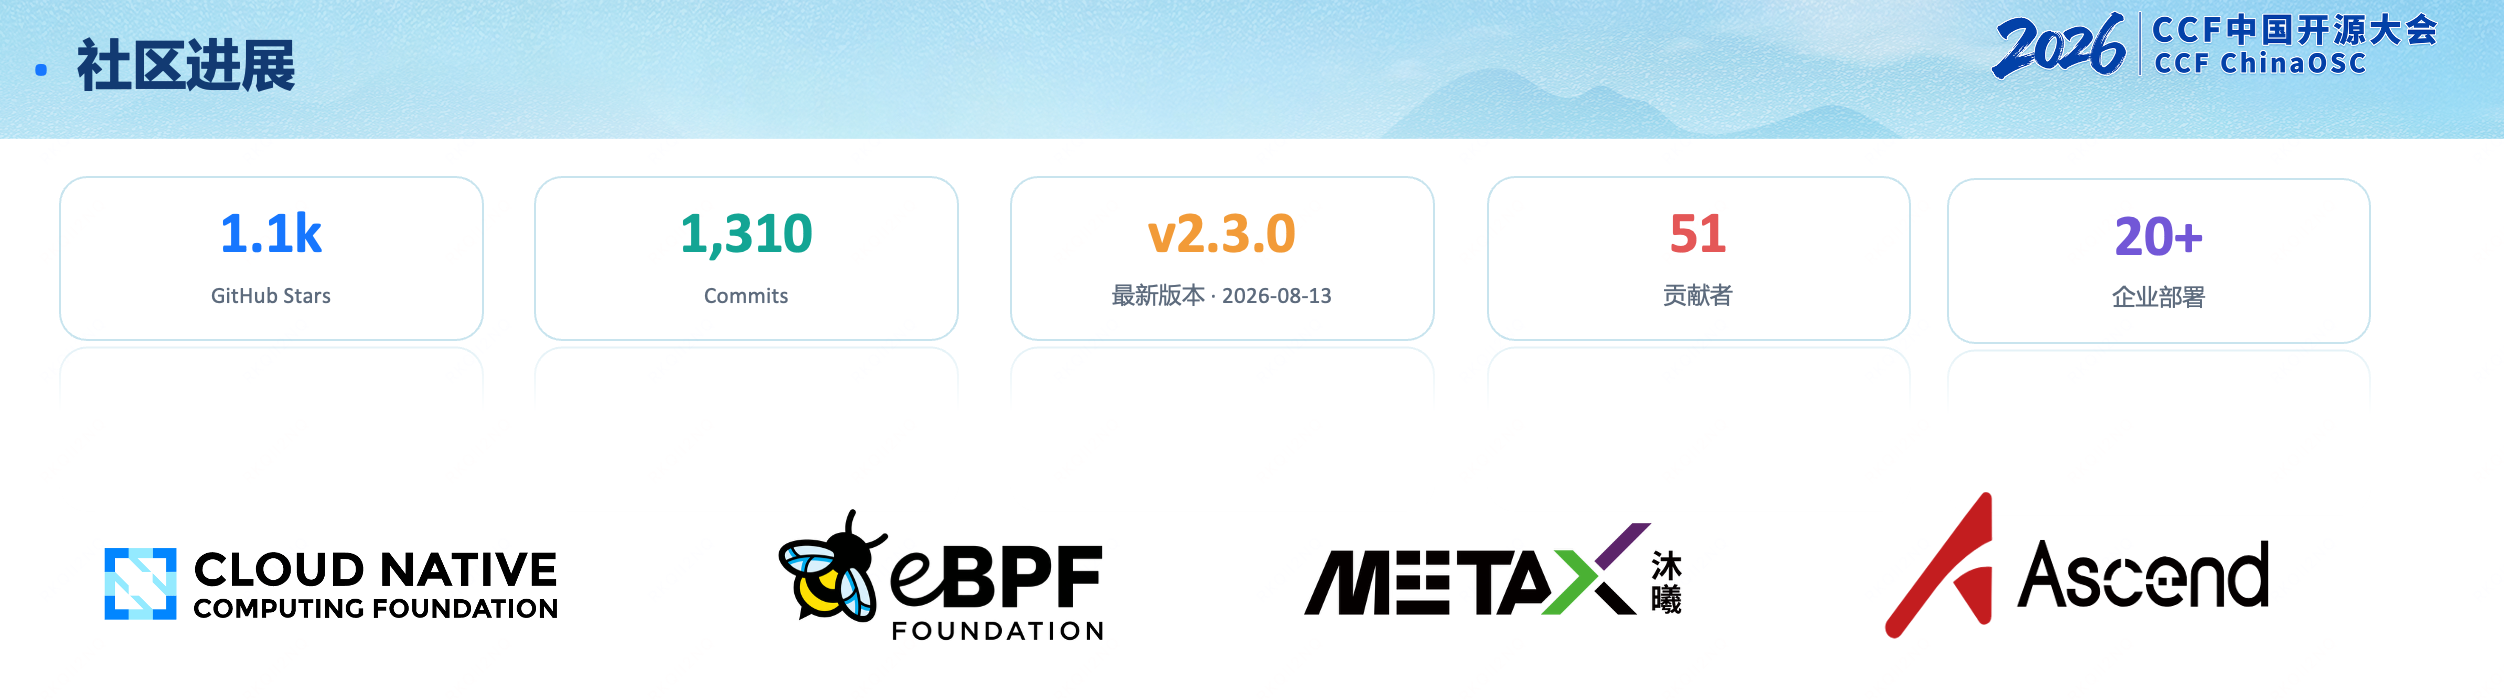
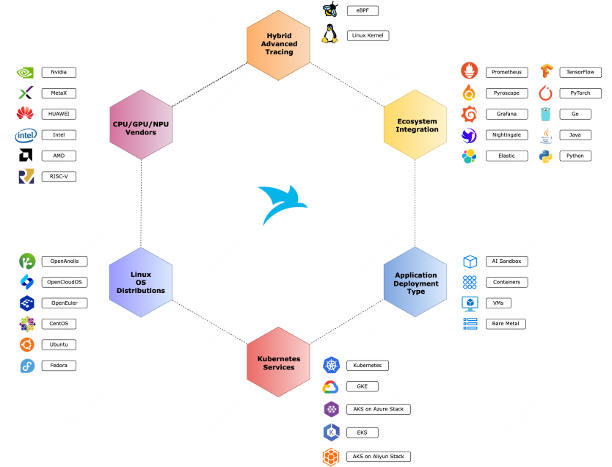
HUATUO has also received recognition from industry and the community for its open-source community building and technical innovation. The project was selected as a Key Project in the CCF-Guanghua Youth Open Source Special Fund Seed Program, has entered the CNCF Landscape, and is listed by the eBPF Foundation as an emerging project.
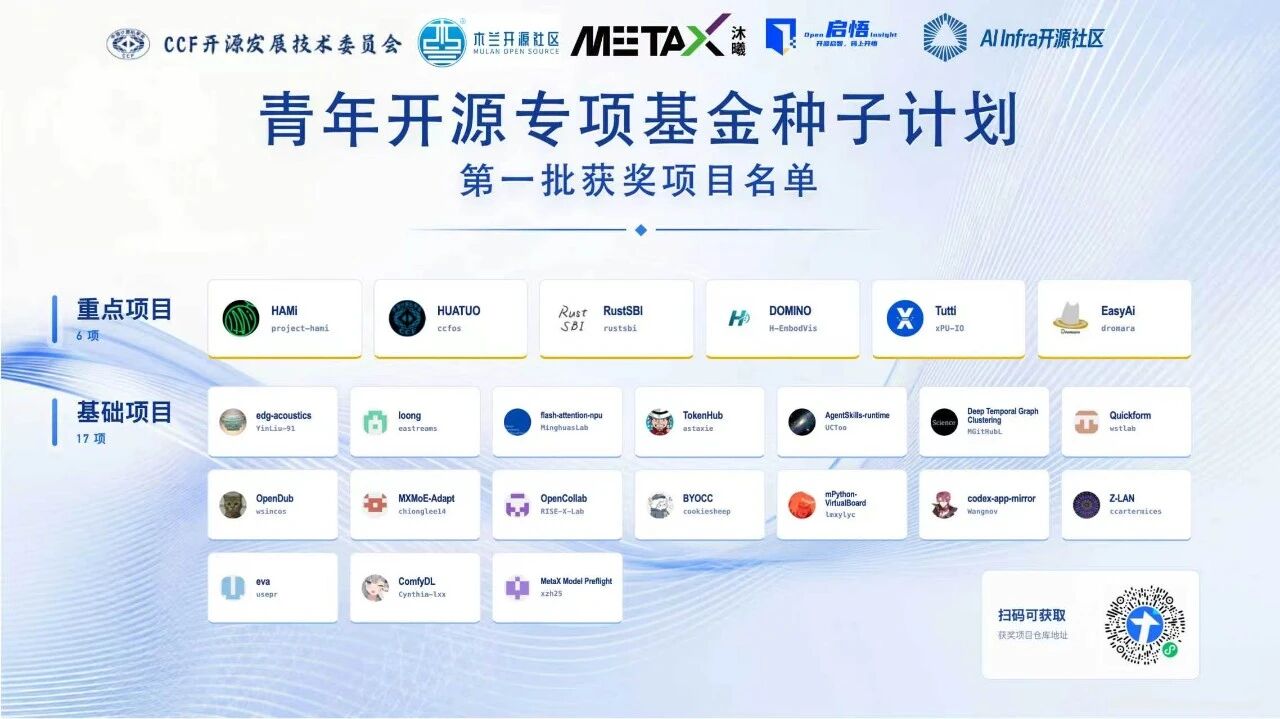
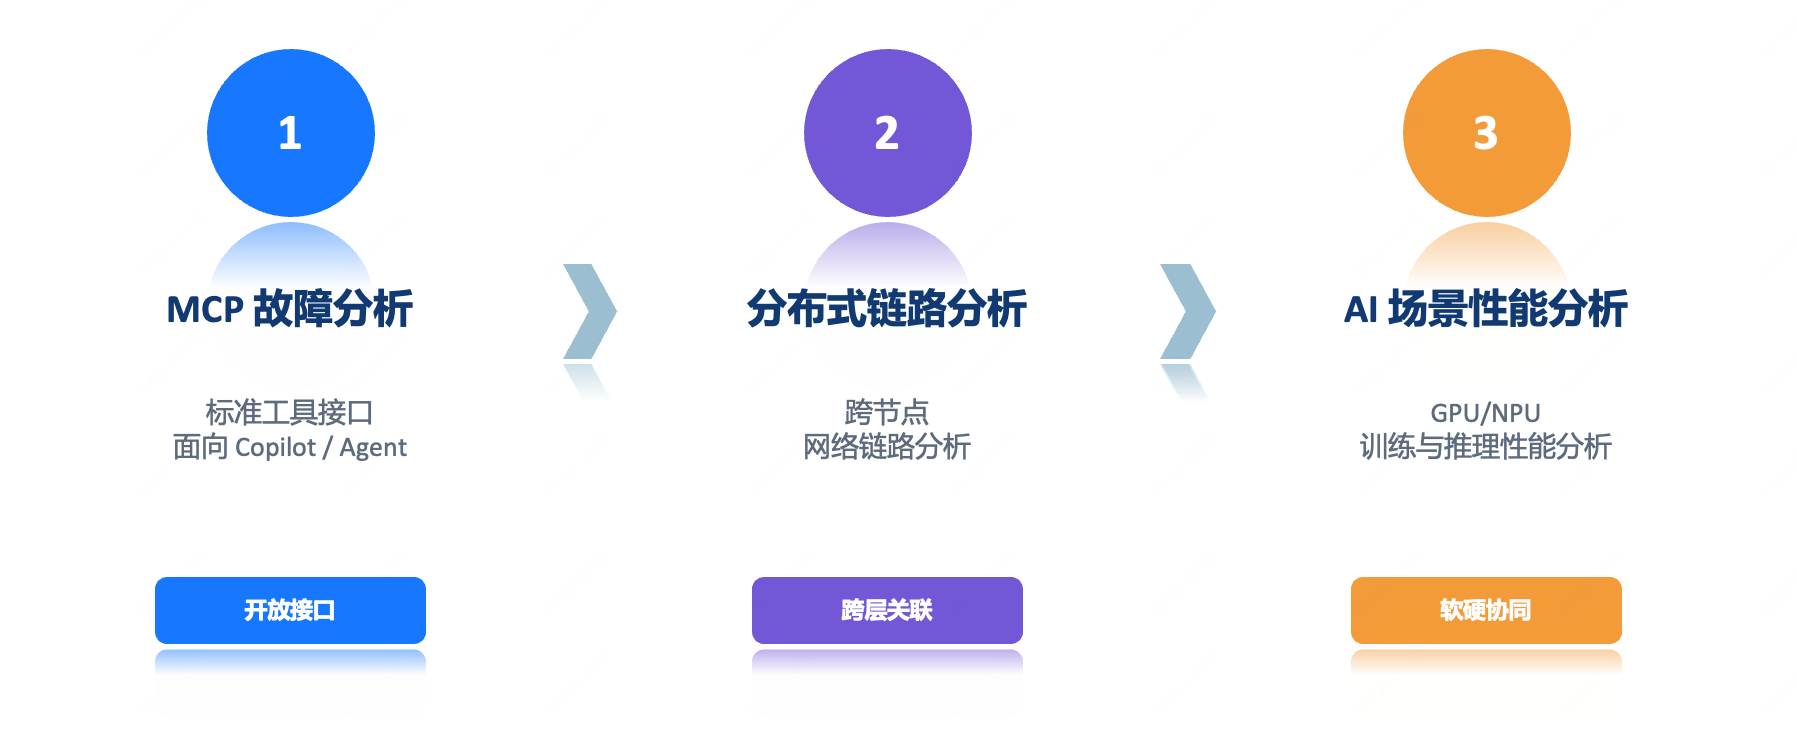
For agent and AI infrastructure, the HUATUO community will continue to build in the following directions, and contributions are welcome:
- MCP-based fault analysis: expose diagnostic capabilities to Copilots and agents through standard tool interfaces;
- Distributed trace analysis: extend single-node kernel scene analysis across nodes, networks, and task chains;
- AI-scenario performance analysis: deepen software–hardware co-analysis for GPU/NPU training and inference.