This is the multi-page printable view of this section. Click here to print.
v2.2.0
- 1: Getting started
- 2: Deploy
- 3: Compile
- 4: Configuration Guide
- 5: Integration Test
- 6: Key Feature
- 6.1: Metrics
- 6.2: Events
- 6.3: Autotracing
- 6.4: Hardware Errors
- 7: Best Practice
- 8: Development
- 8.1: Collection Framework
- 8.2: Add Metrics
- 8.3: Add Event
- 8.4: Add Autotracing
- 9: Frequenty Asked Questions
- 10: Contribute
- 11: Change Log
1 - Getting started
To help users quickly experience and deploy HUATUO, this document is divided into three sections: Quick Experience,Quick Start,Compilation & Deployment.
1. Quick Experience
This section helps you quickly explore the frontend capabilities. You can directly access demo station, such as viewing exception event overviews, exception event context information, metric curves, etc. (Account: huatuo passwd: huatuo1024).
2. Quick Start
2.1 Quick Run
If you want to understand the underlying principles and deploy HUATUO to your own monitoring system, you can start pre-compiled container images via Docker (Note: This method disables container information retrieval and ES storage functionality by default).
-
Direct Execution:
$ docker run --privileged --cgroupns=host --network=host -v /sys:/sys -v /proc:/proc -v /run:/run huatuo/huatuo-bamai:latest -
Metric Collection:In another terminal, collect metrics
$ curl -s localhost:19704/metrics -
View Exception Events (Events, AutoTracing):HUATUO stores collected kernel exception event information in ES (disabled by default) while retaining a copy in the local directory
huatuo-local. Note: Typically, no files exist in this path (systems in normal state don’t trigger event collection). You can generate events by creating exception scenarios or modifying configuration thresholds.
2.2 Quick Setup
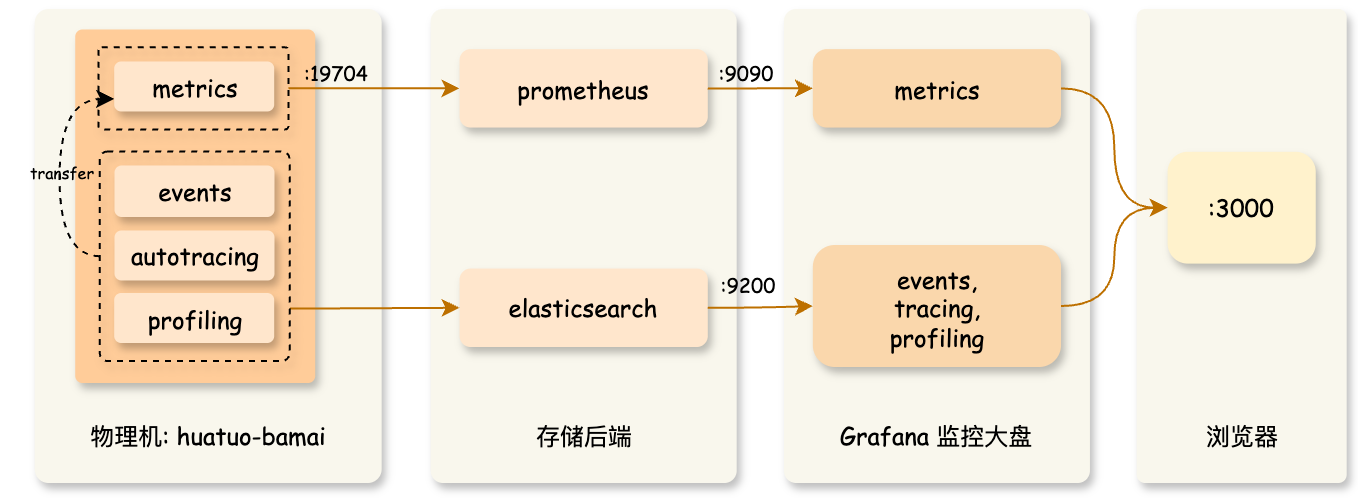
If you want to further understand HUATUO’s operational mechanisms, architecture design, monitoring dashboard, and custom deployment, you can quickly set up a complete local environment using docker compose.
$ docker compose --project-directory ./build/docker up
This command pulls the latest images and starts components including elasticsearch, prometheus, grafana,huatuo-bamai. After successful command execution, open your browser and visit http://localhost:3000 to access the monitoring dashboard (Grafana default admin account: admin, password: admin; Since your system is in normal state, the Events and AutoTracing dashboards typically won’t display data).
3. Compilation & Deployment
3.1 Compilation
To isolate the developer’s local environment and simplify the compilation process, we provide containerized compilation. You can directly use docker build to construct the completed image (including the underlying collector huatuo-bamai, BPF objects, tools, etc.). Run the following command in the project root directory:
$ docker build --network host -t huatuo/huatuo-bamai:latest .
3.2 Execution
-
Run container:
$ docker run --privileged --cgroupns=host --network=host -v /sys:/sys -v /proc:/proc -v /run:/run huatuo/huatuo-bamai:latest -
Or copy all files from the container path
/home/huatuo-bamaiand run manually locally:$ ./huatuo-bamai --region example --config huatuo-bamai.conf -
Management: Can be managed using systemd/supervisord/k8s-DaemonSet, etc.
3.3 Configuration
-
Container Information Configuration
HUATUO obtains POD/container information by calling the kubelet interface. Configure the access interface and certificates according to your actual environment. Empty configuration "" indicates disabling this functionality.
[Pod] KubeletPodListURL = "http://127.0.0.1:10255/pods" KubeletPodListHTTPSURL = "https://127.0.0.1:10250/pods" KubeletPodClientCertPath = "/var/lib/kubelet/pki/kubelet-client-current.pem" -
Storage Configuration
-
Metric Storage (Metric): All metrics are stored in Prometheus. You can access the :19704/metrics interface to obtain metrics.
-
Exception Event Storage (Events, AutoTracing): All kernel events and AutoTracing events are stored in ES. Note: If the configuration is empty, ES storage is not activated, and events are only stored in the local directory
huatuo-local.ES storage configuration is as follows:
[Storage.ES]
    Address = "http://127.0.0.1:9200"
    Username = "elastic"
    Password = "huatuo-bamai"
    Index = "huatuo_bamai"
Local storage configuration is as follows:
# tracer's record data
# Path: all but the last element of path for per tracer
# RotationSize: the maximum size in Megabytes of a record file before it gets rotated for per subsystem
# MaxRotation: the maximum number of old log files to retain for per subsystem
[Storage.LocalFile]
    Path = "huatuo-local"
    RotationSize = 100
    MaxRotation = 10
-
-
Event Thresholds
All kernel event collections (Events and AutoTracing) can have configurable trigger thresholds. The default thresholds are empirical data repeatedly validated in actual production environments. You can modify thresholds in huatuo-bamai.conf according to your requirements.
-
Resource Limits
To ensure host machine stability, we have implemented resource limits for the collector. LimitInitCPU represents CPU resources occupied during collector startup, while LimitCPU/LimitMem represent resource limits for normal operation after successful startup:
[RuntimeCgroup]
    LimitInitCPU = 0.5
    LimitCPU = 2.0
    # limit memory (MB)
    LimitMem = 2048
2 - Deploy
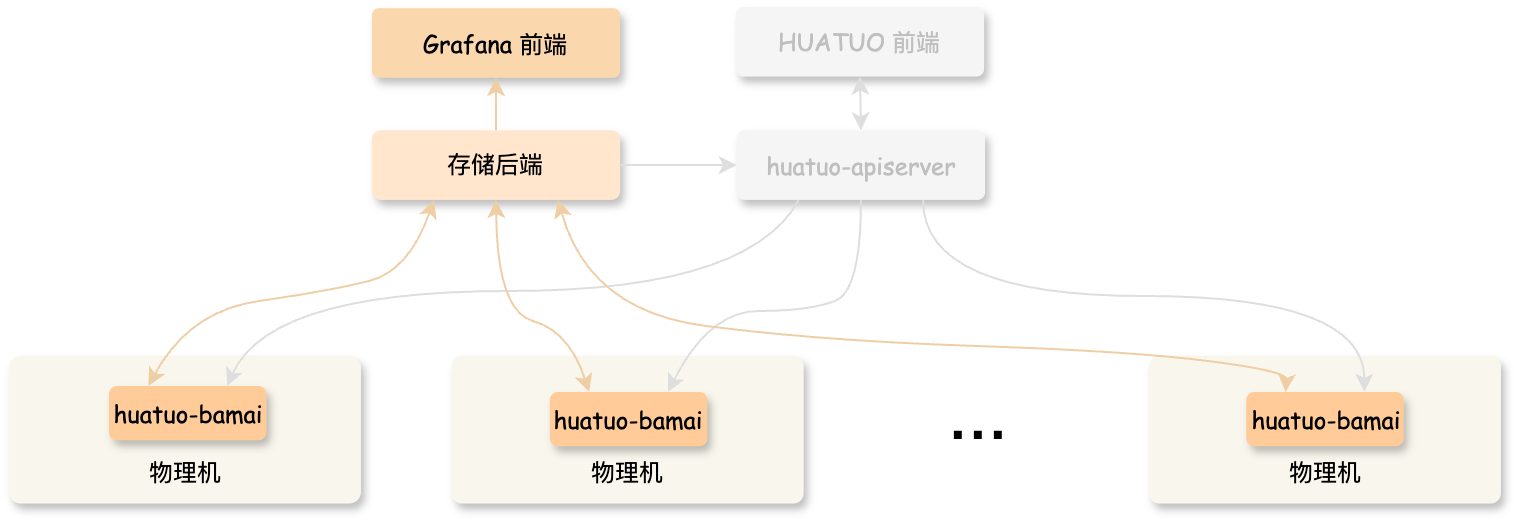
The HUATUO collector huatuo-bamai runs on physical machines or VMs. We provide both binary packages and Docker images, and you can deploy them in any custom way, such as:
- Systemd and DaemonSet deployments are recommended for production.
- Docker / Compose is suitable for development and quick validation scenarios.
Binary Download
The latest binary package provided is v2.1.0; the master branch is for reference only.
Mirror Download
Docker images are stored on Docker Hub by default (https://hub.docker.com/u/huatuo).
2.1 - Docker
Run Only the Collector
Start the Container
docker run --privileged --cgroupns=host --network=host -v /sys:/sys -v /proc:/proc -v /run:/run huatuo/huatuo-bamai:latest
⚠️ This uses the default configuration file inside the container. The internal default configuration does not connect to Elasticsearch. For a complete setup, mount your own
huatuo-bamai.confusing-v, and update the config according to your environment (kubelet access, Elasticsearch settings, local log storage path, etc.).
Deploy All Components (Docker Compose)
For local development and validation, using Docker Compose is the most convenient approach.
You can quickly launch a full environment containing the collector, Elasticsearch, Prometheus, Grafana, and other components.
docker compose --project-directory ./build/docker up
It is recommended to install Docker Compose using the plugin method: https://docs.docker.com/compose/install/linux/
2.2 - Daemonset
HUATUO provides the simplest DaemonSet deployment option to minimize setup complexity. Deploying the HUATUO collector via DaemonSet involves the following steps:
1. Download the Collector Configuration File
curl -L -o huatuo-bamai.conf https://github.com/ccfos/huatuo/raw/main/huatuo-bamai.conf
Modify this configuration file according to your environment, such as kubelet connection settings and Elasticsearch settings.
2. Create a ConfigMap
kubectl create configmap huatuo-bamai-config --from-file=./huatuo-bamai.conf
3. Deploy the Collector
kubectl apply -f huatuo-daemonset.minimal.yaml
Contents of huatuo-daemonset.minimal.yaml:
apiVersion: apps/v1
kind: DaemonSet
metadata:
  name: huatuo
  namespace: default
  labels:
    app: huatuo
spec:
  selector:
    matchLabels:
      app: huatuo
  template:
    metadata:
      labels:
        app: huatuo
    spec:
      containers:
      - name: huatuo
        image: docker.io/huatuo/huatuo-bamai:latest
        resources:
          limits:
            cpu: '1'
            memory: 2Gi
          requests:
            cpu: 500m
            memory: 512Mi
        securityContext:
          privileged: true
        volumeMounts:
        - name: proc
          mountPath: /proc
        - name: sys
          mountPath: /sys
        - name: run
          mountPath: /run
        - name: var
          mountPath: /var
        - name: etc
          mountPath: /etc
        - name: huatuo-local
          mountPath: /home/huatuo-bamai/huatuo-local
        - name: huatuo-bamai-config-volume
          mountPath: /home/huatuo-bamai/conf/huatuo-bamai.conf
          subPath: huatuo-bamai.conf
      volumes:
      - name: proc
        hostPath:
          path: /proc
      - name: sys
        hostPath:
          path: /sys
      - name: run
        hostPath:
          path: /run
      - name: var
        hostPath:
          path: /var
      - name: etc
        hostPath:
          path: /etc
      - name: huatuo-local
        hostPath:
          path: /var/log/huatuo/huatuo-local
          type: DirectoryOrCreate
      - name: huatuo-bamai-config-volume
        configMap:
          name: huatuo-bamai-config
      hostNetwork: true
      hostPID: true
2.3 - Systemd
Install by RPM
OpenCloudOS currently provides the v2.1.0 RPM package; the master is for reference only.
Tencent OpenCloudOS provides an official HUATUO package:
https://mirrors.opencloudos.tech/epol/9/Everything/x86_64/os/Packages/huatuo-bamai-2.1.0-2.oc9.x86_64.rpm
This allows HUATUO to be quickly installed and enabled on OpenCloudOS.
- x86_64 architecture
wget https://mirrors.opencloudos.tech/epol/9/Everything/x86_64/os/Packages/huatuo-bamai-2.1.0-2.oc9.x86_64.rpm
- arm64 architecture
wget https://mirrors.opencloudos.tech/epol/9/Everything/aarch64/os/Packages/huatuo-bamai-2.1.0-2.oc9.aarch64.rpm
- Install HUATUO on OC8
sudo rpm -ivh huatuo-bamai*.rpm
Other RPM-based operating systems can install HUATUO the same way.
As usual, you must update the config file according to your environment (e.g., kubelet connection, Elasticsearch settings).
Full OpenCloudOS installation guide:
https://mp.weixin.qq.com/s/Gmst4_FsbXUIhuJw1BXNnQ
Install by Binary Package
The latest binary package provided is v2.1.0; the master branch is for reference only.
You can also download the binary package and configure/manage it manually.
Again, update the configuration file based on your actual environment (kubelet connection, Elasticsearch settings, etc.).
3 - Compile
1. Build with the Official Image
To isolate the developer’s local environment and simplify the build process, we provide a containerized build method. You can directly use docker build to produce an image containing the core collector huatuo-bamai, BPF objects, tools, and more. Run the following in the project root directory:
docker build --network host -t huatuo/huatuo-bamai:latest .
2. Build a Custom Image
Dockerfile.dev:
FROM golang:1.23.0-alpine AS base
# Speed up Alpine package installation if needed
# RUN sed -i 's/dl-cdn.alpinelinux.org/mirrors.aliyun.com/g' /etc/apk/repositories
RUN apk add --no-cache \
                make \
                clang15 \
                libbpf-dev \
                bpftool \
                curl \
                git

ENV PATH=$PATH:/usr/lib/llvm15/bin

# build huatuo components
FROM base AS build
ARG BUILD_PATH=${BUILD_PATH:-/go/huatuo-bamai}
ARG RUN_PATH=${RUN_PATH:-/home/huatuo-bamai}
WORKDIR ${BUILD_PATH}
2.1 Build the Dev Image
docker build --network host -t huatuo/huatuo-bamai-dev:latest -f ./Dockerfile.dev .
2.2 Run the Dev Container
docker run -it --privileged --cgroupns=host --network=host \
  -v /path/to/huatuo:/go/huatuo-bamai \
  huatuo/huatuo-bamai-dev:latest sh
2.3 Compile Inside the Container
Run:
make
Once the build completes, all artifacts are generated under ./_output.
3. Build on a Physical Machine or VM
The collector depends on the following tools. Install them based on your local environment:
- make
- git
- clang15
- libbpf
- bpftool
- curl
Due to significant differences across local environments, build issues may occur.
To avoid environment inconsistencies and simplify troubleshooting, we strongly recommend using the Docker build approach whenever possible.
4 - Configuration Guide
1. Document Overview
huatuo-bamai is the core collector of HUATUO (a BPF-based metrics and anomaly inspector). Its configuration file defines the data collection scope, probe enablement strategy, metric output format, anomaly detection rules, and logging behavior.
The configuration file uses TOML format and includes multiple sections such as global blacklist, logging, runtime resource limits, storage configuration, and AutoTracing. Each configuration item comes with detailed comments explaining its purpose, default value, and important notes. This document provides a clear and detailed English explanation for every configuration item to help users understand and safely customize the settings.
Note: Most parameters in the configuration file are provided as commented defaults (starting with #). To enable them, remove the # and adjust the values according to your environment. Changes take effect only after restarting the huatuo-bamai process. In production environments, follow the principle of minimalism and avoid enabling high-overhead features unnecessarily.
2. Global Blacklist
# The global blacklist for tracing and metrics
BlackList = ["netdev_hw", "metax_gpu"]
-
BlackList: Global blacklist for tracing and metrics.
Used to exclude specific modules or hardware from tracing and metric collection, preventing irrelevant noise or high-overhead probes. The default value is [“netdev_hw”, “metax_gpu”], which globally disables tracing and metrics related to network device hardware layer (netdev_hw) and Metax GPU.
Description: Adding items to the blacklist can effectively reduce resource consumption, especially in specific hardware environments. It supports array format and can be extended based on actual business needs.
3. Logging
# Log Configuration
#
# - Level
# The log level for huatuo-bamai: Debug, Info, Warn, Error, Panic.
# Default: Info
#
# - File
# Store logs to where the logging file is. If it is empty, don't write log
# to any file.
# Default: empty
#
[Log]
    # Level = "Info"
    # File = ""
-
Level: Log level.
Default: Info. Possible values: Debug, Info, Warn, Error, Panic.
Description: Controls the verbosity of huatuo-bamai logs. In production, Info or Warn is recommended to reduce log volume. Use Debug only for troubleshooting, as it generates substantial output.
-
File: Log file path.
Specifies the path to the log file. If left empty, logs are not written to any file (output goes to stdout or system logs).
Default: empty.
Description: In containerized deployments, configure a specific path and integrate with a log collection system for persistence.
4. Runtime Resource Limits
# Runtime resource limit
#
# - LimitInitCPU
# During the huatuo-bamai startup, the CPU of process are restricted from use.
# Default is 0.5 CPU.
#
# - LimitCPU
# The CPU resource restricted once the process starts.
# Default is 2.0 CPU.
#
# - LimitMem
# The memory resource limitted for huatuo-bamai process.
# Default is 2048MB.
#
[RuntimeCgroup]
    # LimitInitCPU = 0.5
    # LimitCPU = 2.0
    # LimitMem = 2048
-
LimitInitCPU: CPU limit during startup phase.
Restricts CPU cores usable by the huatuo-bamai process during initialization.
Default: 0.5 CPU.
Description: Prevents excessive CPU usage during startup from affecting host business workloads. Value is in CPU cores (supports decimals).
-
LimitCPU: Runtime CPU limit.
Restricts CPU resources after the process has started.
Default: 2.0 CPU.
Description: Adjust based on node scale and workload. In high-density container environments, lower this value appropriately to ensure business stability.
-
LimitMem: Memory resource limit.
Maximum memory allowed for the huatuo-bamai process.
Default: 2048 MB.
Description: Enforced via cgroup to prevent OOM (Out Of Memory) issues. In production, increase as needed according to collection scale.
5. Storage
5.1 Elasticsearch Storage
# Storage configuration
[Storage]
    # Elasticsearch Storage
    #
    # Disable ES storage if one of Address, Username, Password is empty.
    # Store the tracing and events data of linux kernel to ES.
    #
    # - Address
    # Default address is :9200 of localhost. ...
    #
    # - Index
    # Elasticsearch index, a logical namespace that holds a collection of
    # documents for huatuo-bamai.
    # Default: huatuo_bamai
    #
    # - Username
    # - Password
    # There is no default username and password.
    #
    [Storage.ES]
        # Address = "http://127.0.0.1:9200"
        # Index = "huatuo_bamai"
        Username = "elastic"
        Password = "huatuo-bamai"
-
Address: Elasticsearch service address.
Default: http://127.0.0.1:9200.
Description: Used to store kernel tracing and event data. ES storage is disabled if any of Address, Username, or Password is empty. Port 9200 is the standard HTTP API port for Elasticsearch.
-
Index: Elasticsearch index name.
Default: huatuo_bamai.
Description: Logical namespace for organizing huatuo-bamai tracing and event documents.
-
Username: ES authentication username.
No default value (example uses elastic).
Description: Used for Basic Auth.
-
Password: ES authentication password.
No default value (example uses huatuo-bamai).
Description: Used together with the username. In production, use a strong password and enable TLS encryption.
Overall: ES storage persists kernel tracing and event data for later search and analysis.
5.2 Local File Storage
# LocalFile Storage
#
# Store data to local directory for troubleshooting on the host machine.
#
# - Path
# The directory for storing data. If the Path is empty, LocalFile will be disabled.
# Default: "huatuo-local"
#
# - RotationSize
# The maximum size in Megabytes of a record file before it gets rotated
# for per linux kernel tracer.
# Default: 100MB
#
# - MaxRotation
# The maximum number of old log files to retain for per tracer.
# Default: 10
#
[Storage.LocalFile]
    # Path = "huatuo-local"
    # RotationSize = 100
    # MaxRotation = 10
-
Path: Local data storage directory.
Default: huatuo-local. If empty, local file storage is disabled.
Description: Stores data locally on the host for on-site troubleshooting. Use an absolute path.
-
RotationSize: Single file rotation size.
Maximum size of a record file before rotation (per tracer).
Default: 100 MB.
Description: Prevents any single file from growing too large and consuming excessive disk space.
-
MaxRotation: Maximum number of rotated files to retain.
Default: 10.
Description: Oldest files are automatically deleted once the limit is reached, controlling disk usage.
6. Automatic Tracing
The automatic tracing module is one of HUATUO’s intelligent features. It triggers specific performance tracing based on thresholds, reducing manual intervention.
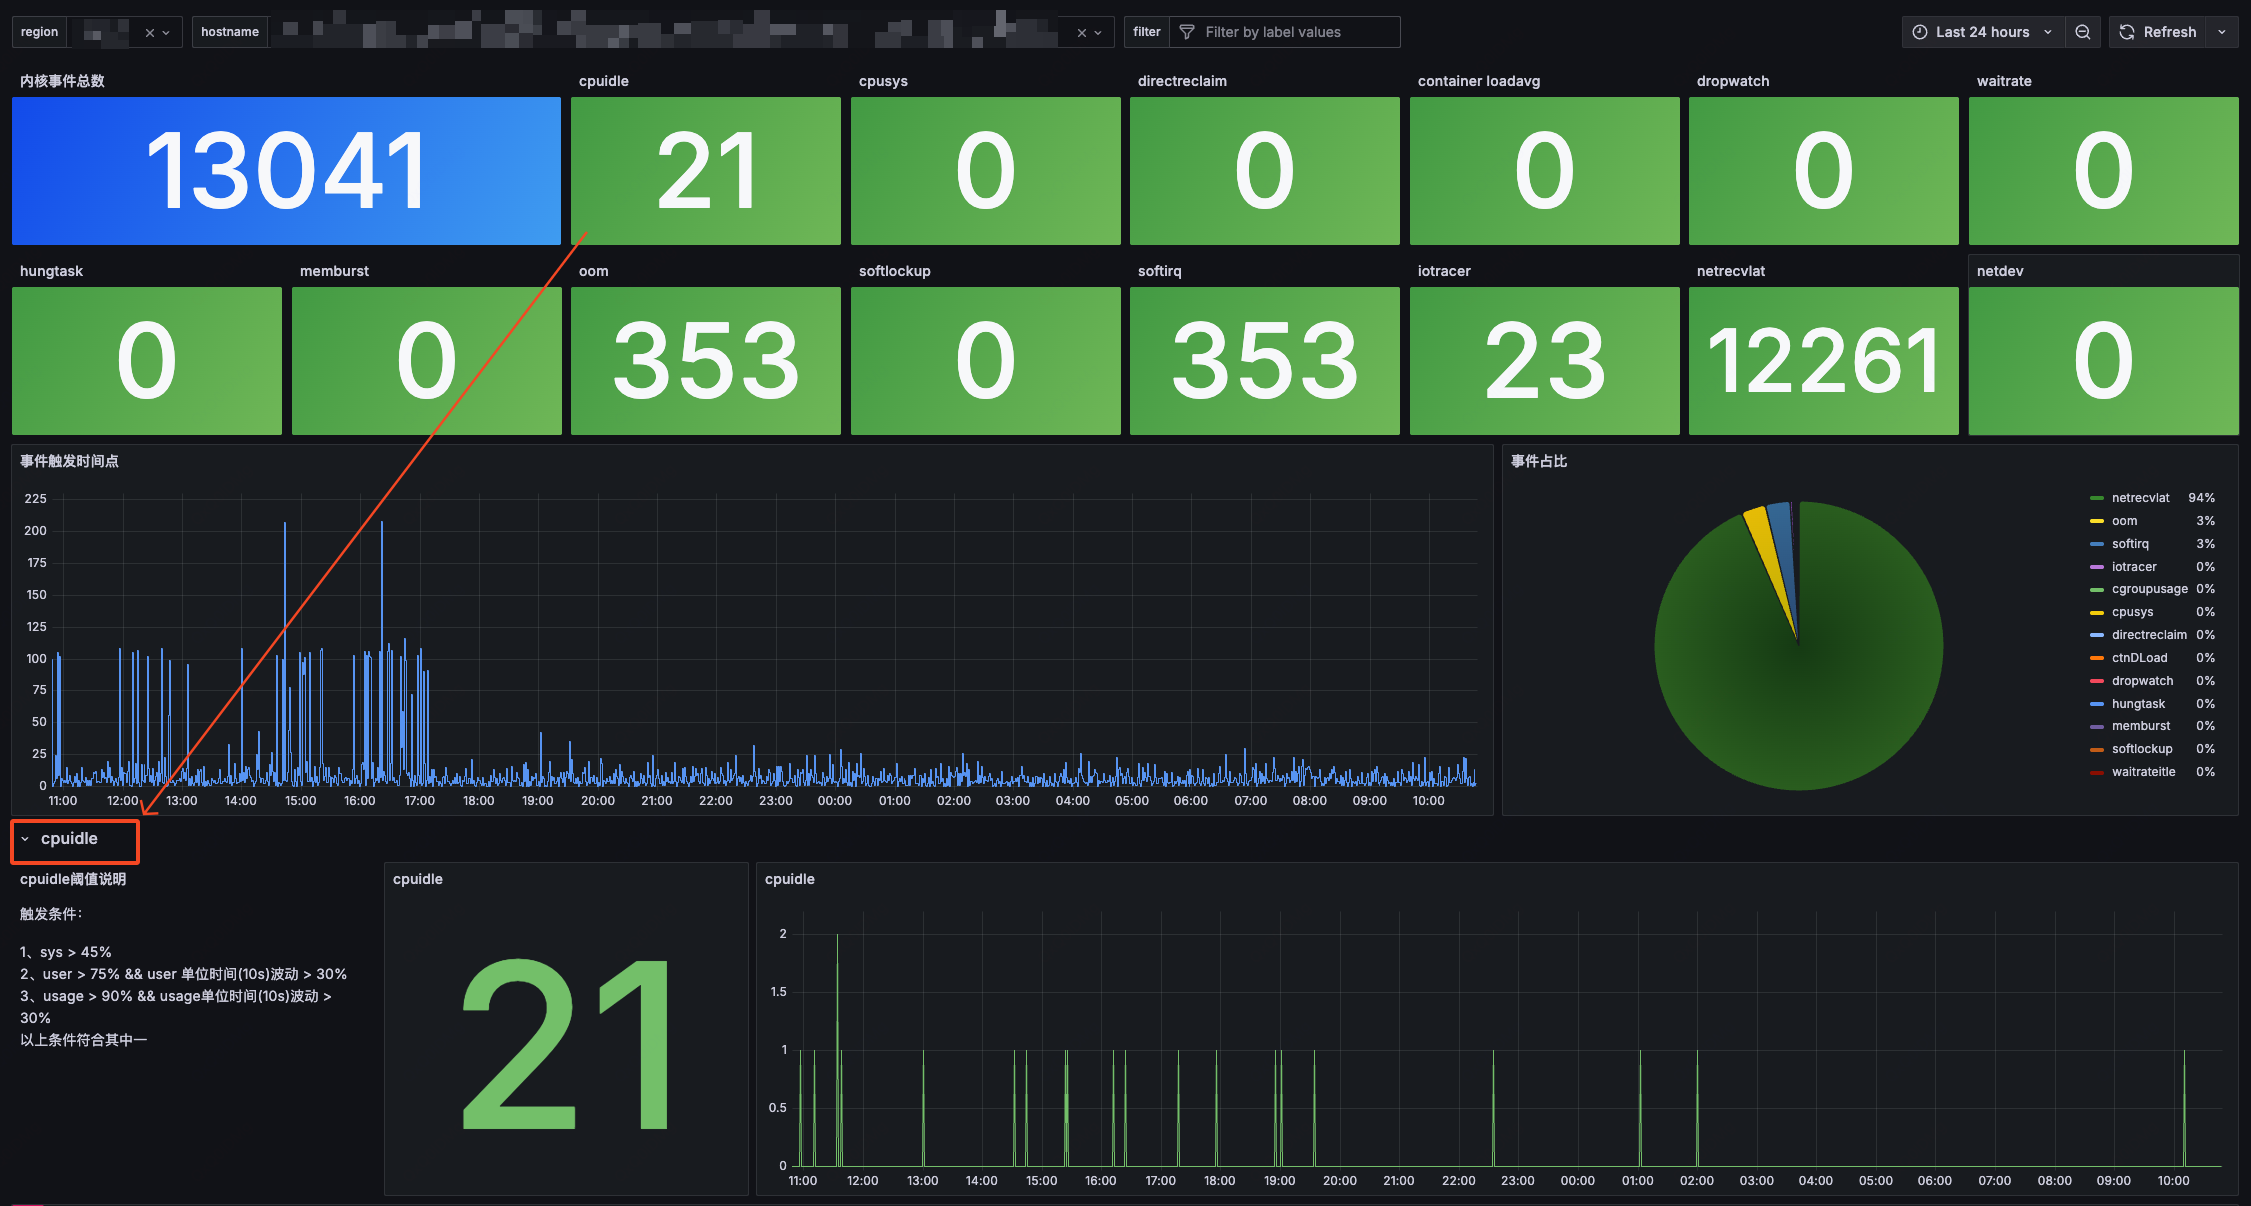
6.1 CPUIdle Automatic Tracing — Sudden High CPU Usage in Containers
# Autotracing configuration
[AutoTracing]
    # cpuidle
    #
    # For a high cpu usage all of a sudden in containers.
    #
    # - UserThreshold
    # User CPU usage threshold, when cpu usage reaches this threshold, cpu
    # performance tracing will be triggered.
    # Default: 75%
    #
    # - SysThreshold
    # System CPU usage threshold, when reaching this threshold, cpu performance
    # tracing will be triggered.
    # Default: 45%
    #
    # - UsageThreshold
    # The total cpu usage (system + user cpu usage) threshold, when reaching
    # this threshold, cpu performance tracing will be triggered.
    # Default: 45%
    #
    # - DeltaUserThreshold
    # The range of this user cpu changes within a short period of time.
    # Default: 45%
    #
    # - DeltaSysThreshold
    # The range of this system cpu changes within a short period of time.
    # Default: 20%
    #
    # - DeltaUsageThreshold
    # The range of this cpu usage changes within a short period of time.
    # Default: 55%
    #
    # - Interval
    # The sample interval of the cpu usage for all containers.
    # Default: 10s
    #
    # - IntervalTracing
    # Time since last run. Avoid frequently executing this tracing to prevent
    # damage to the system.
    # Default: 1800s
    #
    # - RunTracingToolTimeout
    # The executing time of this tracing program.
    # Default: 10s
    #
    # NOTE:
    # Running this performance tool, when:
    # 1. UserThreshold and DeltaUserThreshold are true, or
    # 2. SysThreshold and DeltaSysThreshold are true, or
    # 3. UsageThreshold and DeltaUsageThreshold
    #
    [AutoTracing.CPUIdle]
        # UserThreshold = 75
        # SysThreshold = 45
        # UsageThreshold = 90
        # DeltaUserThreshold = 45
        # DeltaSysThreshold = 20
        # DeltaUsageThreshold = 55
        # Interval = 10
        # IntervalTracing = 1800
        # RunTracingToolTimeout = 10
-
UserThreshold: User-mode CPU usage threshold (%).
Default: 75%.
-
SysThreshold: System-mode CPU usage threshold (%).
Default: 45%.
-
UsageThreshold: Total CPU usage threshold (%).
Default: 90% (as shown in comments).
-
DeltaUserThreshold: Short-term user CPU change threshold (%).
Default: 45%.
-
DeltaSysThreshold: Short-term system CPU change threshold (%).
Default: 20%.
-
DeltaUsageThreshold: Short-term total CPU change threshold (%).
Default: 55%.
-
Interval: CPU usage sampling interval (seconds).
Default: 10s.
-
IntervalContinuousRun (or IntervalTracing): Minimum interval between runs (seconds).
Default: 1800s (30 minutes).
-
RunTracingToolTimeout: Single tracing execution timeout (seconds).
Default: 10s.
Trigger Logic: Tracing runs when any of the following is true:
- Both UserThreshold and DeltaUserThreshold are met, or
- Both SysThreshold and DeltaSysThreshold are met, or
- Both UsageThreshold and DeltaUsageThreshold are met.
6.2 CPUSys Automatic Tracing — Sudden High System CPU on Host
# cpusys
#
# For a high system cpu usage all of a sudden on host machine.
#
# - SysThreshold
# System CPU usage threshold, when reaching this threshold, cpu performance
# tracing will be triggered.
# Default: 45%
#
# - DeltaSysThreshold
# The range of system cpu changes within a short period of time.
# Default: 20%
#
# - Interval
# The sample interval of the cpu usage for host machine.
# Default: 10s
#
# - RunTracingToolTimeout
# The executing time of this tracing program.
# Default: 10s
#
# NOTE:
# Running this performance tool, when:
# SysThreshold and DeltaSysThreshold are true.
#
[AutoTracing.CPUSys]
	# SysThreshold = 45
	# DeltaSysThreshold = 20
	# Interval = 10
	# RunTracingToolTimeout = 10
-
SysThreshold: System CPU usage threshold (%).
Default: 45%.
-
DeltaSysThreshold: Short-term system CPU change threshold (%).
Default: 20%.
-
Interval: Host CPU usage sampling interval (seconds).
Default: 10s.
-
RunTracingToolTimeout: Tracing execution timeout (seconds).
Default: 10s.
Trigger Logic: Tracing is triggered when both SysThreshold and DeltaSysThreshold are satisfied.
6.3 Dload AutoTracing — D-State Task Profiling for Containers
# dload
#
# linux tasks D state profiling for containers.
#
# - ThresholdLoad
# The loadavg threshold value, when reaching this threshold, dload profiling
# is triggered.
# Defalut: 5
#
# - Interval
# The sample interval of the load for all containers.
# Default: 10s
#
# - IntervalTracing
# Time since last run. Avoid frequently executing this tracing to prevent
# damage to the system.
# Default: 1800s
#
[AutoTracing.Dload]
	# ThresholdLoad = 5
	# Interval = 10
	# IntervalTracing = 1800
-
ThresholdLoad: System load average (loadavg) threshold for containers.
Default: 5. Triggers D-state (uninterruptible sleep) task profiling when loadavg reaches this value.
-
Interval: Monitoring interval.
Default: 10s.
-
IntervalTracing: Minimum time between consecutive tracings.
Default: 1800s (30 minutes).
6.4 IOTracing AutoTracing — Container IO Performance Profiling
# iotracing
#
# io profiling for containers.
#
# - WbpsThreshold
# Max write bytes per second, when reaching this threshold, iotracing is triggered.
# Please note that if it is an NVMe device, it must also meet the UtilThreshold.
# Default: 1500 MB/s
#
# - RbpsThreshold
# Max read bytes per second, when reaching this threshold, iotracing is triggered.
# Please note that if it is an NVMe device, it must also meet the UtilThreshold.
# Default: 2000 MB/s
#
# - UtilThreshold
# Disk utilization, Percentage of time the disk is busy. If this is consistently
# above 80-90%, the disk may be a bottleneck.
# Default: 90%
#
# - AwaitThreshold
# Await (Average IO wait time in ms): High values indicate slow disk response times.
# Default: 100ms
#
# - RunTracingToolTimeout
# The executing time of this tracing tool.
# Default: 10s
#
# - MaxProcDump
# The number of processes displayed by iotracing tool.
# Default: 10
#
# - MaxFilesPerProcDump
# The number of files per process displayed by iotracing tool.
# Default: 5
#
[AutoTracing.IOTracing]
	# WbpsThreshold = 1500
	# RbpsThreshold = 2000
	# UtilThreshold = 90
	# AwaitThreshold = 100
	# RunTracingToolTimeout = 10
	# MaxProcDump = 10
	# MaxFilesPerProcDump = 5
-
WbpsThreshold: Max write bytes per second threshold (MB/s).
Default: 1500. (For NVMe, must also meet UtilThreshold.)
-
RbpsThreshold: Max read bytes per second threshold (MB/s).
Default: 2000.
-
UtilThreshold: Disk utilization threshold (%).
Default: 90%.
-
AwaitThreshold: Average IO wait time threshold (ms).
Default: 100ms.
-
RunIOTracingTimeout: IO tracing tool timeout (seconds).
Default: 10s.
-
MaxProcDump: Maximum number of processes to display.
Default: 10.
-
MaxFilesPerProcDump: Maximum files per process to display.
Default: 5.
Description: Used for diagnosing IO hotspots in containers, especially under high disk load.
6.5 MemoryBurst AutoTracing
This module detects sudden memory usage spikes on the host and automatically captures kernel context to help diagnose memory pressure events.
# memory burst
#
# If there is a memory used burst on the host, capture this kernel context.
#
# - Interval
# The sample interval of the memory used.
# Default: 10s
#
# - DeltaMemoryBurst
# A certain percentage of memory burst used. 100% that means, e.g.,
# memory used increased from 200MB to 400MB.
# Default: 100%
#
# - DeltaAnonThreshold
# A certain percentage of anon memory burst used. 100% that means, e.g.,
# anon memory used increased from 200MB to 400MB.
# Default: 70%
#
# - IntervalTracing
# Time since last run. Avoid frequently executing this tracing
# to prevent damage to the system.
# Default: 1800s
#
# - DumpProcessMaxNum
# How many processes to dump when this event is triggered.
# Default: 10
#
[AutoTracing.MemoryBurst]
	# DeltaMemoryBurst = 100
	# DeltaAnonThreshold = 70
	# Interval = 10
	# IntervalTracing = 1800
	# SlidingWindowLength = 60
	# DumpProcessMaxNum = 10
-
DeltaMemoryBurst: Memory usage burst growth percentage threshold.
Default: 100%.
-
DeltaAnonThreshold: Anonymous memory burst growth percentage threshold.
Default: 70%.
-
Interval: Memory usage sampling interval (seconds).
Default: 10s.
-
IntervalTracing: Minimum interval between runs (seconds).
Default: 1800s.
-
SlidingWindowLength: Sliding window length (seconds).
Default: 60s.
-
DumpProcessMaxNum: Maximum processes to dump on trigger.
Default: 10.
7. Event Tracing
This section is responsible for capturing key kernel events and monitoring latency, including softirq, memory reclaim, network receive latency, network device events, and packet drop monitoring. It is the core module for kernel-level anomaly context collection in HUATUO.
7.1 Softirq Disable Tracing
# linux kernel events capturing configuration
[EventTracing]
	# softirq
	#
	# tracing the softirq disabled events of linux kernel.
	#
	# - DisabledThreshold
	# When the disable duration of softirq exceeds the threshold, huatuo-bamai
	# will collect kernel context.
	# Default: 10000000 in nanoseconds, 10ms
	#
	[EventTracing.Softirq]
		# DisabledThreshold = 10000000
-
DisabledThreshold: Softirq disable duration threshold (nanoseconds).
Default: 10,000,000 ns (10ms). When softirq is disabled longer than this threshold, kernel context is collected.
Description: Long softirq disable periods can cause delays in networking, timers, etc. Useful for diagnosing interrupt storms or high-load scenarios.
7.2 Memory Reclaim Blocking Tracing
# memreclaim
#
# The memory reclaim may block the process, if one process is blocked
# for a long time, reporting the events to userspace.
#
# - BlockedThreshold
# The blocked time when memory reclaiming.
# Default: 900000000ns, 900ms
#
[EventTracing.MemoryReclaim]
	# BlockedThreshold = 900000000
-
BlockedThreshold: Memory reclaim blocking time threshold (nanoseconds).
Default: 900,000,000 ns (900ms). When a process is blocked by memory reclaim for longer than this time, an event is reported to userspace with context.
Description: Memory reclaim blocking is a common cause of process stalls, especially in memory-constrained cloud-native environments.
7.3 Network Receive Latency Tracing
# networking rx latency
#
# linux net stack rx latency for every tcp skbs.
#
# - Driver2NetRx
# The latency from driver to net rx, e.g., netif_receive_skb.
# Default: 5ms
#
# - Driver2TCP
# The latency from driver to tcp rx, e.g., tcp_v4_rcv.
# Default: 10ms
#
# - Driver2Userspace
# The latency from driver to userspace copy data, e.g., skb_copy_datagram_iovec.
# Default: 115ms
#
# - ExcludedContainerQos
# Don't care the containers which qos level is in ExcludedContainerQos.
# This is a string slice in vendor/k8s.io/api/core/v1/types.go
# - PodQOSGuaranteed = "Guaranteed"
# - PodQOSBurstable = "Burstable"
# - PodQOSBestEffort = "BestEffort"
#
# Default: []
#
# - ExcludedHostNetnamespace
# Don't care the skbs, packets in the host net namespace.
# Default: true
#
[EventTracing.NetRxLatency]
	# Driver2NetRx = 5
	# Driver2TCP = 10
	# Driver2Userspace = 115
	# ExcludedContainerQos = []
	ExcludedContainerQos = ["bestEffort"]
	# ExcludedHostNetnamespace = true
-
Driver2NetRx: Latency threshold from driver to network receive layer (e.g., netif_receive_skb).
Default: 5ms.
-
Driver2TCP: Latency threshold from driver to TCP receive (e.g., tcp_v4_rcv).
Default: 10ms.
-
Driver2Userspace: Latency threshold from driver to userspace data copy (e.g., skb_copy_datagram_iovec).
Default: 115ms.
-
ExcludedContainerQos: List of container QoS levels to exclude from monitoring.
Default: []. Corresponds to Kubernetes Pod QoS levels (Guaranteed, Burstable, BestEffort).
-
ExcludedHostNetnamespace: Whether to exclude packets in the host network namespace.
Default: true.
7.4 Network Device Event Monitoring
# netdev events
#
# monitor the net device events.
#
# - DeviceList
# The net devices we take care of.
# Default: [] is empty, meaning no devices.
#
[EventTracing.Netdev]
	DeviceList = ["eth0", "eth1", "bond4", "lo"]
-
DeviceList: List of network devices to monitor.
Default example includes “eth0”, “eth1”, “bond4”, “lo”. An empty list means no devices are monitored.
Description: Monitors physical link status events for specified network interfaces.
7.5 Packet Drop Monitoring
# dropwatch
#
# monitor packets dropped events in the Linux kernel.
#
# - ExcludedNeighInvalidate
# Don't care of neigh_invalidate drop events.
# Default: true
#
[EventTracing.Dropwatch]
	# ExcludedNeighInvalidate = true
-
ExcludedNeighInvalidate: Whether to exclude packet drops caused by neigh_invalidate.
Default: true.
Description: Neighbor table related drops are usually normal behavior; excluding them reduces false positives.
8. Metric Collector
This section defines collection rules for various system and network metrics, supporting fine-grained include/exclude filters for both host and container environments.
8.1 Netdev Statistics
# Metric Collector
[MetricCollector]
	# Netdev statistic
	#
	# - EnableNetlink
	# Use netlink instead of procfs net/dev to get netdev statistic.
	# Only support the host environment to use `netlink` now.
	# Default is "false".
	#
	# - DeviceIncluded
	# Accept special devices in netdev statistic.
	# Default: [] is empty, meaning include all.
	#
	# - DeviceExcluded
	# Exclude special devices in netdev statistic. 'DeviceExcluded' has higher
	# priority than 'DeviceIncluded'.
	# Default: [] is empty, meaning ignore nothing.
	#
	[MetricCollector.NetdevStats]
		# EnableNetlink = false
		# DeviceIncluded = ""
		DeviceExcluded = "^(lo)|(docker\\w*)|(veth\\w*)$"
-
EnableNetlink: Use netlink instead of procfs to collect netdev statistics.
Default: false. Currently only supported on the host.
-
DeviceIncluded: Specific devices to include in statistics.
Default: include all.
-
DeviceExcluded: Regular expression to exclude devices.
Default excludes loopback, docker, and veth interfaces. DeviceExcluded has higher priority.
8.2 Netdev DCB Collection
# netdev dcb, DCB (Data Center Bridging)
#
# Collecting the DCB PFC (Priority-based Flow Control).
#
# - DeviceList
# The net devices we take care of.
# Default: [] is empty, meaning no devices.
#
[MetricCollector.NetdevDCB]
	DeviceList = ["eth0", "eth1"]
-
DeviceList: List of network devices for which DCB (Data Center Bridging) PFC information is collected.
Default: empty.
8.3 Netdev Hardware Statistics
# netdev hardware statistic
#
# Collecting the hardware statistic of net devices, e.g, rx_dropped.
#
# - DeviceList
# The net devices we take care of.
# Default: [] is empty, meaning no devices.
#
[MetricCollector.NetdevHW]
	DeviceList = ["eth0", "eth1"]
-
DeviceList: List of network devices for hardware-level statistics (e.g., rx_dropped).
Default: empty.
8.4 Qdisc Collection
# Qdisc
#
# - DeviceIncluded
# - DeviceExcluded same as above.
#
[MetricCollector.Qdisc]
	# DeviceIncluded = ""
	DeviceExcluded = "^(lo)|(docker\\w*)|(veth\\w*)$"
- DeviceIncluded / DeviceExcluded: Same logic as NetdevStats, used to control which network devices’ queue disciplines are monitored.
8.5 vmstat Metric Collection
# vmstat
#
# This metric supports host vmstat and cgroup vmstat.
# - IncludedOnHost
# - ExcludedOnHost same as above, for the host /proc/vmstat.
#
# - IncludedOnContainer
# - ExcludedOnContainer as above, for the cgroup, containers memory.stat.
#
[MetricCollector.Vmstat]
	IncludedOnHost = "allocstall|nr_active_anon|nr_active_file|nr_boost_pages|nr_dirty|nr_free_pages|nr_inactive_anon|nr_inactive_file|nr_kswapd_boost|nr_mlock|nr_shmem|nr_slab_reclaimable|nr_slab_unreclaimable|nr_unevictable|nr_writeback|numa_pages_migrated|pgdeactivate|pgrefill|pgscan_direct|pgscan_kswapd|pgsteal_direct|pgsteal_kswapd"
	ExcludedOnHost = "total"
	IncludedOnContainer = "active_anon|active_file|dirty|inactive_anon|inactive_file|pgdeactivate|pgrefill|pgscan_direct|pgscan_kswapd|pgsteal_direct|pgsteal_kswapd|shmem|unevictable|writeback|pgscan_globaldirect|pgscan_globalkswapd|pgscan_cswapd|pgsteal_cswapd|pgsteal_globaldirect|pgsteal_globalkswapd"
	ExcludedOnContainer = "total"
-
IncludedOnHost / ExcludedOnHost: Include/exclude fields for host /proc/vmstat.
-
IncludedOnContainer / ExcludedOnContainer: Include/exclude fields for container cgroup memory.stat.
8.6 Other Metric Collections
# MemoryEvents/Netstat/MountPointStat
#
# - Included
# - Excluded same as above, DeviceInclude, DeviceExclude.
#
[MetricCollector.MemoryEvents]
	Included = "watermark_inc|watermark_dec"
	# Excluded = ""
[MetricCollector.Netstat]
	# Excluded = ""
	# Included = ""

# MountPointStat
[MetricCollector.MountPointStat]
	MountPointsIncluded = "(^/home$$   )|(^/   $$)|(^/boot$)"
-
Included / Excluded: Control which fields are collected for MemoryEvents and Netstat.
-
MountPointsIncluded: Regular expression for mount points to collect statistics. Default example includes root, /home, and /boot.
9. Pod
This section configures how to fetch Pod information from kubelet to enable container/Pod-level labeling and metric isolation.
# Pod Configuration
#
# Configure these parameters for fetching pods from kubelet.
#
# - KubeletReadOnlyPort
# The KubeletReadOnlyPort is kubelet read-only port for the Kubelet to serve on with
# no authentication/authorization. The port number must be between 1 and 65535, inclusive.
# Setting this field to 0 disables fetching pods from kubelet read-only service.
# Default: 10255
#
# - KubeletAuthorizedPort
# The port is the HTTPs port of the kubelet. The port number must be between 1 and 65535,
# inclusive. Setting this field to 0 disables fetching pods from kubelet HTTPS port.
# Default: 10250
#
# - KubeletClientCertPath
# https://kubernetes.io/docs/setup/best-practices/certificates/
#
# Client certificate and private key file name. One file or two files:
# "/path/to/xxx-kubelet-client.crt,/path/to/xxx-kubelet-client.key",
# "/path/to/kubelet-client-current.pem"
#
# You can disable this kubelet fetching pods, for bare metal service, by
# KubeletReadOnlyPort = 0, and KubeletAuthorizedPort = 0.
#
[Pod]
	KubeletClientCertPath = "/etc/kubernetes/pki/apiserver-kubelet-client.crt,/etc/kubernetes/pki/apiserver-kubelet-client.key"
-
KubeletReadOnlyPort: Kubelet read-only port.
Default: 10255. Set to 0 to disable this method.
-
KubeletAuthorizedPort: Kubelet HTTPS authorized port.
Default: 10250. Set to 0 to disable.
-
KubeletClientCertPath: Path to kubelet client certificate and private key. Supports comma-separated files or single PEM file.
Description: Used for mTLS authentication on the HTTPS port. In non-Kubernetes (bare-metal) environments, set both ports to 0 to disable Pod fetching.
10. Best Practices and Important Notes
- Resource Control: In production, prioritize adjusting CPU and memory limits in [RuntimeCgroup] to avoid impacting business containers.
- Storage Choice: For small-scale deployments, prefer [Storage.LocalFile] for local troubleshooting. For large clusters, configure Elasticsearch for centralized storage and querying.
- AutoTracing Tuning: Adjust thresholds based on workload characteristics. Thresholds that are too low cause frequent triggering; thresholds that are too high may miss issues. Validate gradually in a test environment.
- Security: Use strong passwords for ES configuration and consider enabling HTTPS. Avoid hard-coding sensitive information in the configuration file.
- Compatibility: Configuration parameters may be affected by kernel version and hardware environment. Always verify with the official HUATUO documentation for your specific setup.
By properly configuring huatuo-bamai.conf, you can fully leverage HUATUO’s capabilities in kernel-level anomaly detection and intelligent tracing, significantly improving observability and troubleshooting efficiency in cloud-native systems.
If you need deeper customization for a specific scenario, feel free to provide more details about your environment.
5 - Integration Test
This integration test validates that huatuo-bamai can start correctly with mocked /proc and /sys filesystems and expose the expected Prometheus metrics.
The test runs the real huatuo-bamai binary and verifies the /metricsendpoint output without relying on the host kernel or hardware.
What the Script Does
The integration test performs the following steps:
- Generates a temporary
bamai.conf - Starts
huatuo-bamaiwith mockedprocfsandsysfs - Waits for the Prometheus
/metricsendpoint to become available - Fetches all metrics from
/metrics - Verifies that all expected metrics exist
- Stops the service and cleans up resources
If any expected metric is missing, the test fails.
How to Run
Run the integration test from the project root:
bash integration/run.sh
or
make integration
On Failure
- The
huatuo-bamaiservice metrics and logs are printed to stdout - The temporary working directory is kept for debugging
On Success
- Output the list of successfully validated metrics
How to Add New Metrics Tests
1: Add or Update Fixture Data
If the metric depends on /proc or /sys, add or update mock data under:
integration/fixtures/
The directory structure should match the real kernel filesystem layout.
2: Add Expected Metrics
Create a new file under:
integration/fixtures/expected_metrics/
├── cpu.txt
├── memory.txt
└── ...
Each non-empty, non-comment line represents one expected Prometheus metric line and must match the /metrics output exactly.
New *.txt files are automatically picked up by the test.
3: Run the Test
bash integration/run.sh
The test fails if any expected metric is missing or mismatched.
6 - Key Feature
6.1 - Metrics
Metrics supported in the current version:
CPU
Scheduling
The following metrics allow observation of process scheduling latency, i.e., the time from when a process becomes runnable (placed in the run queue) until it actually starts executing on the CPU.
# HELP huatuo_bamai_runqlat_container_latency cpu run queue latency for the containers
# TYPE huatuo_bamai_runqlat_container_latency gauge
huatuo_bamai_runqlat_container_latency{container_host="coredns-855c4dd65d-8v5kg",container_hostnamespace="kube-system",container_level="burstable",container_name="coredns",container_type="normal",host="hostname",region="dev",zone="0"} 226
huatuo_bamai_runqlat_container_latency{container_host="coredns-855c4dd65d-8v5kg",container_hostnamespace="kube-system",container_level="burstable",container_name="coredns",container_type="normal",host="hostname",region="dev",zone="1"} 0
huatuo_bamai_runqlat_container_latency{container_host="coredns-855c4dd65d-8v5kg",container_hostnamespace="kube-system",container_level="burstable",container_name="coredns",container_type="normal",host="hostname",region="dev",zone="2"} 0
huatuo_bamai_runqlat_container_latency{container_host="coredns-855c4dd65d-8v5kg",container_hostnamespace="kube-system",container_level="burstable",container_name="coredns",container_type="normal",host="hostname",region="dev",zone="3"} 0

# HELP huatuo_bamai_runqlat_latency cpu run queue latency for the host
# TYPE huatuo_bamai_runqlat_latency gauge
huatuo_bamai_runqlat_latency{host="hostname",region="dev",zone="0"} 35100
huatuo_bamai_runqlat_latency{host="hostname",region="dev",zone="1"} 0
huatuo_bamai_runqlat_latency{host="hostname",region="dev",zone="2"} 0
huatuo_bamai_runqlat_latency{host="hostname",region="dev",zone="3"} 0
| Metric | Description | Unit | Target | Source | Labels |
|---|---|---|---|---|---|
| runqlat_container_latency | scheduling latency histogram buckets: zone0: 0–10 ms zone1: 10–20 ms zone2: 20–50 ms zone3: 50+ ms |
count | Container | eBPF | container_host, container_hostnamespace, container_level, container_name, container_type, host, region, zone |
| runqlat_latency | scheduling latency histogram buckets: zone0, 0~10ms zone1, 10-20ms zone2, 20-50ms zone3, 50+ms |
count | Host | eBPF | host, region, zone |
SoftIRQ
SoftIRQ response latency on different CPUs (currently only NET_RX and NET_TX are collected).
# HELP huatuo_bamai_softirq_latency softirq latency
# TYPE huatuo_bamai_softirq_latency gauge
huatuo_bamai_softirq_latency{cpuid="0",host="hostname",region="dev",type="NET_RX",zone="0"} 125
huatuo_bamai_softirq_latency{cpuid="0",host="hostname",region="dev",type="NET_RX",zone="1"} 2
huatuo_bamai_softirq_latency{cpuid="0",host="hostname",region="dev",type="NET_RX",zone="2"} 0
huatuo_bamai_softirq_latency{cpuid="0",host="hostname",region="dev",type="NET_RX",zone="3"} 0
huatuo_bamai_softirq_latency{cpuid="0",host="hostname",region="dev",type="NET_TX",zone="0"} 0
huatuo_bamai_softirq_latency{cpuid="0",host="hostname",region="dev",type="NET_TX",zone="1"} 0
huatuo_bamai_softirq_latency{cpuid="0",host="hostname",region="dev",type="NET_TX",zone="2"} 0
huatuo_bamai_softirq_latency{cpuid="0",host="hostname",region="dev",type="NET_TX",zone="3"} 0
huatuo_bamai_softirq_latency{cpuid="1",host="hostname",region="dev",type="NET_RX",zone="0"} 110
huatuo_bamai_softirq_latency{cpuid="1",host="hostname",region="dev",type="NET_RX",zone="1"} 0
huatuo_bamai_softirq_latency{cpuid="1",host="hostname",region="dev",type="NET_RX",zone="2"} 1
huatuo_bamai_softirq_latency{cpuid="1",host="hostname",region="dev",type="NET_RX",zone="3"} 0
huatuo_bamai_softirq_latency{cpuid="1",host="hostname",region="dev",type="NET_TX",zone="0"} 0
huatuo_bamai_softirq_latency{cpuid="1",host="hostname",region="dev",type="NET_TX",zone="1"} 0
huatuo_bamai_softirq_latency{cpuid="1",host="hostname",region="dev",type="NET_TX",zone="2"} 0
| Metric | Description | Unit | Target | Source | Labels |
|---|---|---|---|---|---|
| softirq_latency | SoftIRQ response latency histogram buckets: zone0, 0-10us zone1, 10-100us zone2, 100-1000us zone3, 1+ms |
count | Host | eBPF | cpuid, host, region, type, zone |
Utilization
Metrics showing CPU usage on hosts and containers (Prometheus format):
# HELP huatuo_bamai_cpu_util_sys cpu sys for the host
# TYPE huatuo_bamai_cpu_util_sys gauge
huatuo_bamai_cpu_util_sys{host="hostname",region="dev"} 6.268857848549965e-06
# HELP huatuo_bamai_cpu_util_total cpu total for the host
# TYPE huatuo_bamai_cpu_util_total gauge
huatuo_bamai_cpu_util_total{host="hostname",region="dev"} 1.7736934944144352e-05
# HELP huatuo_bamai_cpu_util_usr cpu usr for the host
# TYPE huatuo_bamai_cpu_util_usr gauge
huatuo_bamai_cpu_util_usr{host="hostname",region="dev"} 1.1468077095594387e-05

# HELP huatuo_bamai_cpu_util_container_sys cpu sys for the containers
# TYPE huatuo_bamai_cpu_util_container_sys gauge
huatuo_bamai_cpu_util_container_sys{container_host="coredns-855c4dd65d-8v5kg",container_hostnamespace="kube-system",container_level="burstable",container_name="coredns",container_type="normal",host="hostname",region="dev"} 1.6708593420881415e-07
# HELP huatuo_bamai_cpu_util_container_total cpu total for the containers
# TYPE huatuo_bamai_cpu_util_container_total gauge
huatuo_bamai_cpu_util_container_total{container_host="coredns-855c4dd65d-8v5kg",container_hostnamespace="kube-system",container_level="burstable",container_name="coredns",container_type="normal",host="hostname",region="dev"} 3.379584661890774e-07
# HELP huatuo_bamai_cpu_util_container_usr cpu usr for the containers
# TYPE huatuo_bamai_cpu_util_container_usr gauge
huatuo_bamai_cpu_util_container_usr{container_host="coredns-855c4dd65d-8v5kg",container_hostnamespace="kube-system",container_level="burstable",container_name="coredns",container_type="normal",host="hostname",region="dev"} 1.7087253017325962e-07
| Metric | Description | Unit | Target | Labels |
|---|---|---|---|---|
| cpu_util_sys | CPU system (kernel) time % | % | Host | host, region |
| cpu_util_usr | CPU user time % | % | Host | host, region |
| cpu_util_total | CPU total utilization % | % | Host | host, region |
| cpu_util_container_sys | Container CPU system time % | % | Container | container_host,container_hostnamespace,container_level,container_name,container_type,host,region |
| cpu_util_container_usr | Container CPU user time % | % | Container | container_host,container_hostnamespace,container_level,container_name,container_type,host,region |
| cpu_util_container_total | Container CPU total % | % | Container | container_host,container_hostnamespace,container_level,container_name,container_type,host,region |
Allocation
Container CPU resource configuration:
# HELP huatuo_bamai_cpu_util_container_cores cpu core number for the containers
# TYPE huatuo_bamai_cpu_util_container_cores gauge
huatuo_bamai_cpu_util_container_cores{container_host="coredns-855c4dd65d-8v5kg",container_hostnamespace="kube-system",container_level="Burstable",container_name="coredns",container_type="Normal",host="hostname",region="dev"} 6
| Metric | Description | Unit | Target | Labels |
|---|---|---|---|---|
| cpu_util_container_cores | Number of CPU cores | cores | Container | (same as above) |
Contention
Metrics reflecting container throttling and contention:
# HELP huatuo_bamai_cpu_stat_container_nr_throttled throttle nr for the containers
# TYPE huatuo_bamai_cpu_stat_container_nr_throttled gauge
huatuo_bamai_cpu_stat_container_nr_throttled{container_host="coredns-855c4dd65d-8v5kg",container_hostnamespace="kube-system",container_level="burstable",container_name="coredns",container_type="normal",host="hostname",region="dev"} 0
# HELP huatuo_bamai_cpu_stat_container_throttled_time throttle time for the containers
# TYPE huatuo_bamai_cpu_stat_container_throttled_time gauge
huatuo_bamai_cpu_stat_container_throttled_time{container_host="coredns-855c4dd65d-8v5kg",container_hostnamespace="kube-system",container_level="burstable",container_name="coredns",container_type="normal",host="hostname",region="dev"} 0
| Metric | Description | Unit | Target | Labels |
|---|---|---|---|---|
| cpu_stat_container_nr_throttled | Number of times the cgroup was throttled | count | Container | container_host, container_hostnamespace, container_level, container_name, container_type, host, region |
| cpu_stat_container_throttled_time | Total time the cgroup was throttled | nanoseconds | Container | container_host, container_hostnamespace, container_level, container_name, container_type, host, region |
Ref:
- https://docs.kernel.org/scheduler/sched-bwc.html#statistics
- https://www.kernel.org/doc/html/latest/admin-guide/cgroup-v2.html#cpu-interface-files
Future metrics (Didi kernel extensions – not yet public):
# HELP huatuo_bamai_cpu_stat_container_wait_rate wait rate for the containers
# TYPE huatuo_bamai_cpu_stat_container_wait_rate gauge
huatuo_bamai_cpu_stat_container_wait_rate{container_host="coredns-855c4dd65d-8v5kg",container_hostnamespace="kube-system",container_level="burstable",container_name="coredns",container_type="normal",host="hostname",region="dev"} 0
# HELP huatuo_bamai_cpu_stat_container_throttle_wait_rate throttle wait rate for the containers
# TYPE huatuo_bamai_cpu_stat_container_throttle_wait_rate gauge
huatuo_bamai_cpu_stat_container_throttle_wait_rate{container_host="coredns-855c4dd65d-8v5kg",container_hostnamespace="kube-system",container_level="burstable",container_name="coredns",container_type="normal",host="hostname",region="dev"} 0
# HELP huatuo_bamai_cpu_stat_container_inner_wait_rate inner wait rate for the containers
# TYPE huatuo_bamai_cpu_stat_container_inner_wait_rate gauge
huatuo_bamai_cpu_stat_container_inner_wait_rate{container_host="coredns-855c4dd65d-8v5kg",container_hostnamespace="kube-system",container_level="burstable",container_name="coredns",container_type="normal",host="hostname",region="dev"} 0
# HELP huatuo_bamai_cpu_stat_container_exter_wait_rate exter wait rate for the containers
# TYPE huatuo_bamai_cpu_stat_container_exter_wait_rate gauge
huatuo_bamai_cpu_stat_container_exter_wait_rate{container_host="coredns-855c4dd65d-8v5kg",container_hostnamespace="kube-system",container_level="burstable",container_name="coredns",container_type="normal",host="hostname",region="dev"} 0
Burst Behavior
Metrics showing burst usage beyond quota:
# HELP huatuo_bamai_cpu_stat_container_nr_bursts burst nr for the containers
# TYPE huatuo_bamai_cpu_stat_container_nr_bursts gauge
huatuo_bamai_cpu_stat_container_nr_bursts{container_host="coredns-855c4dd65d-8v5kg",container_hostnamespace="kube-system",container_level="burstable",container_name="coredns",container_type="normal",host="hostname",region="dev"} 0
huatuo_bamai_cpu_stat_container_nr_bursts{container_host="coredns-855c4dd65d-mnpqf",container_hostnamespace="kube-system",container_level="burstable",container_name="coredns",container_type="normal",host="hostname",region="dev"} 0
# HELP huatuo_bamai_cpu_stat_container_burst_time burst time for the containers
# TYPE huatuo_bamai_cpu_stat_container_burst_time gauge
huatuo_bamai_cpu_stat_container_burst_time{container_host="coredns-855c4dd65d-8v5kg",container_hostnamespace="kube-system",container_level="burstable",container_name="coredns",container_type="normal",host="hostname",region="dev"} 0
huatuo_bamai_cpu_stat_container_burst_time{container_host="coredns-855c4dd65d-mnpqf",container_hostnamespace="kube-system",container_level="burstable",container_name="coredns",container_type="normal",host="hostname",region="dev"} 0
| Metric | Description | Unit | Target | Labels |
|---|---|---|---|---|
| cpu_stat_container_burst_time | Cumulative wall-clock time spent above quota across all periods | count | Container | container_host, container_hostnamespace, container_level, container_name, container_type, host, region |
| cpu_stat_container_nr_bursts | Number of periods in which usage exceeded quota | count | Container | container_host, container_hostnamespace, container_level, container_name, container_type, host, region |
Load
Load average and runnable/uninterruptible task counts:
# HELP huatuo_bamai_loadavg_load1 system load average, 1 minute
# TYPE huatuo_bamai_loadavg_load1 gauge
huatuo_bamai_loadavg_load1{host="hostname",region="dev"} 0.3
# HELP huatuo_bamai_loadavg_load15 system load average, 15 minutes
# TYPE huatuo_bamai_loadavg_load15 gauge
huatuo_bamai_loadavg_load15{host="hostname",region="dev"} 0.22
# HELP huatuo_bamai_loadavg_load5 system load average, 5 minutes
# TYPE huatuo_bamai_loadavg_load5 gauge
huatuo_bamai_loadavg_load5{host="hostname",region="dev"} 0.2
# HELP huatuo_bamai_loadavg_container_nr_running nr_running of container
# TYPE huatuo_bamai_loadavg_container_nr_running gauge
huatuo_bamai_loadavg_container_nr_running{container_host="coredns-855c4dd65d-8v5kg",container_hostnamespace="kube-system",container_level="burstable",container_name="coredns",container_type="normal",host="hostname",region="dev"} 1
# HELP huatuo_bamai_loadavg_container_nr_uninterruptible nr_uninterruptible of container
# TYPE huatuo_bamai_loadavg_container_nr_uninterruptible gauge
huatuo_bamai_loadavg_container_nr_uninterruptible{container_host="coredns-855c4dd65d-8v5kg",container_hostnamespace="kube-system",container_level="burstable",container_name="coredns",container_type="normal",host="hostname",region="dev"} 0
| Metric | Description | Unit | Target | Labels | |
|---|---|---|---|---|---|
| loadavg_load1 | 1-minute system load average | count | Host | host, region | |
| loadavg_load5 | 5-minute system load average | count | Host | host, region | |
| loadavg_load15 | 15-minute system load average | count | Host | host, region | |
| loadavg_container_container_nr_running | Number of running tasks in container | count | Container | host, region | cgroup v1 only |
| loadavg_container_container_nr_uninterruptible | Number of uninterruptible tasks in container | count | Container | host, region | cgroup v1 only |
Memory System
Reclaim
Metrics showing time spent stalled due to memory reclaim/compaction:
# HELP huatuo_bamai_memory_free_allocpages_stall time stalled in alloc pages
# TYPE huatuo_bamai_memory_free_allocpages_stall gauge
huatuo_bamai_memory_free_allocpages_stall{host="hostname",region="dev"} 0
# HELP huatuo_bamai_memory_free_compaction_stall time stalled in memory compaction
# TYPE huatuo_bamai_memory_free_compaction_stall gauge
huatuo_bamai_memory_free_compaction_stall{host="hostname",region="dev"} 0
# HELP huatuo_bamai_memory_reclaim_container_directstall counter of cgroup reclaim when try_charge
# TYPE huatuo_bamai_memory_reclaim_container_directstall gauge
huatuo_bamai_memory_reclaim_container_directstall{container_host="coredns-855c4dd65d-8v5kg",container_hostnamespace="kube-system",container_level="burstable",container_name="coredns",container_type="normal",host="hostname",region="dev"} 0
| Metric | Description | Unit | Target | Source | Labels |
|---|---|---|---|---|---|
| memory_free_allocpages_stall | Time stalled waiting for page allocation | nanoseconds | Host | eBPF | host, region |
| memory_free_compaction_stall | Time stalled in memory compaction | nanoseconds | Host | eBPF | host, region |
| memory_reclaim_container_directstall | Number of direct reclaim events in container | count | Container | eBPF | container_host, container_hostnamespace, container_level, container_name, container_type, host, region |
State
From cgroup memory.stat:
# HELP huatuo_bamai_memory_vmstat_container_active_anon cgroup memory.stat active_anon
# TYPE huatuo_bamai_memory_vmstat_container_active_anon gauge
huatuo_bamai_memory_vmstat_container_active_anon{container_host="coredns-855c4dd65d-8v5kg",container_hostnamespace="kube-system",container_level="burstable",container_name="coredns",container_type="normal",host="hostname",region="dev"} 1.47456e+07
# HELP huatuo_bamai_memory_vmstat_container_active_file cgroup memory.stat active_file
# TYPE huatuo_bamai_memory_vmstat_container_active_file gauge
huatuo_bamai_memory_vmstat_container_active_file{container_host="coredns-855c4dd65d-8v5kg",container_hostnamespace="kube-system",container_level="burstable",container_name="coredns",container_type="normal",host="hostname",region="dev"} 2.3617536e+07
# HELP huatuo_bamai_memory_vmstat_container_file_dirty cgroup memory.stat file_dirty
# TYPE huatuo_bamai_memory_vmstat_container_file_dirty gauge
huatuo_bamai_memory_vmstat_container_file_dirty{container_host="coredns-855c4dd65d-8v5kg",container_hostnamespace="kube-system",container_level="burstable",container_name="coredns",container_type="normal",host="hostname",region="dev"} 0
# HELP huatuo_bamai_memory_vmstat_container_file_writeback cgroup memory.stat file_writeback
# TYPE huatuo_bamai_memory_vmstat_container_file_writeback gauge
huatuo_bamai_memory_vmstat_container_file_writeback{container_host="coredns-855c4dd65d-8v5kg",container_hostnamespace="kube-system",container_level="burstable",container_name="coredns",container_type="normal",host="hostname",region="dev"} 0
# HELP huatuo_bamai_memory_vmstat_container_inactive_anon cgroup memory.stat inactive_anon
# TYPE huatuo_bamai_memory_vmstat_container_inactive_anon gauge
huatuo_bamai_memory_vmstat_container_inactive_anon{container_host="coredns-855c4dd65d-8v5kg",container_hostnamespace="kube-system",container_level="burstable",container_name="coredns",container_type="normal",host="hostname",region="dev"} 0
# HELP huatuo_bamai_memory_vmstat_container_inactive_file cgroup memory.stat inactive_file
# TYPE huatuo_bamai_memory_vmstat_container_inactive_file gauge
huatuo_bamai_memory_vmstat_container_inactive_file{container_host="coredns-855c4dd65d-8v5kg",container_hostnamespace="kube-system",container_level="burstable",container_name="coredns",container_type="normal",host="hostname",region="dev"} 65536
# HELP huatuo_bamai_memory_vmstat_container_pgdeactivate cgroup memory.stat pgdeactivate
# TYPE huatuo_bamai_memory_vmstat_container_pgdeactivate gauge
huatuo_bamai_memory_vmstat_container_pgdeactivate{container_host="coredns-855c4dd65d-8v5kg",container_hostnamespace="kube-system",container_level="burstable",container_name="coredns",container_type="normal",host="hostname",region="dev"} 0
# HELP huatuo_bamai_memory_vmstat_container_pgrefill cgroup memory.stat pgrefill
# TYPE huatuo_bamai_memory_vmstat_container_pgrefill gauge
huatuo_bamai_memory_vmstat_container_pgrefill{container_host="coredns-855c4dd65d-8v5kg",container_hostnamespace="kube-system",container_level="burstable",container_name="coredns",container_type="normal",host="hostname",region="dev"} 0
# HELP huatuo_bamai_memory_vmstat_container_pgscan_direct cgroup memory.stat pgscan_direct
# TYPE huatuo_bamai_memory_vmstat_container_pgscan_direct gauge
huatuo_bamai_memory_vmstat_container_pgscan_direct{container_host="coredns-855c4dd65d-8v5kg",container_hostnamespace="kube-system",container_level="burstable",container_name="coredns",container_type="normal",host="hostname",region="dev"} 0
# HELP huatuo_bamai_memory_vmstat_container_pgscan_kswapd cgroup memory.stat pgscan_kswapd
# TYPE huatuo_bamai_memory_vmstat_container_pgscan_kswapd gauge
huatuo_bamai_memory_vmstat_container_pgscan_kswapd{container_host="coredns-855c4dd65d-8v5kg",container_hostnamespace="kube-system",container_level="burstable",container_name="coredns",container_type="normal",host="hostname",region="dev"} 0
# HELP huatuo_bamai_memory_vmstat_container_pgsteal_direct cgroup memory.stat pgsteal_direct
# TYPE huatuo_bamai_memory_vmstat_container_pgsteal_direct gauge
huatuo_bamai_memory_vmstat_container_pgsteal_direct{container_host="coredns-855c4dd65d-8v5kg",container_hostnamespace="kube-system",container_level="burstable",container_name="coredns",container_type="normal",host="hostname",region="dev"} 0
# HELP huatuo_bamai_memory_vmstat_container_pgsteal_kswapd cgroup memory.stat pgsteal_kswapd
# TYPE huatuo_bamai_memory_vmstat_container_pgsteal_kswapd gauge
huatuo_bamai_memory_vmstat_container_pgsteal_kswapd{container_host="coredns-855c4dd65d-8v5kg",container_hostnamespace="kube-system",container_level="burstable",container_name="coredns",container_type="normal",host="hostname",region="dev"} 0
# HELP huatuo_bamai_memory_vmstat_container_shmem cgroup memory.stat shmem
# TYPE huatuo_bamai_memory_vmstat_container_shmem gauge
huatuo_bamai_memory_vmstat_container_shmem{container_host="coredns-855c4dd65d-8v5kg",container_hostnamespace="kube-system",container_level="burstable",container_name="coredns",container_type="normal",host="hostname",region="dev"} 0
# HELP huatuo_bamai_memory_vmstat_container_shmem_thp cgroup memory.stat shmem_thp
# TYPE huatuo_bamai_memory_vmstat_container_shmem_thp gauge
huatuo_bamai_memory_vmstat_container_shmem_thp{container_host="coredns-855c4dd65d-8v5kg",container_hostnamespace="kube-system",container_level="burstable",container_name="coredns",container_type="normal",host="hostname",region="dev"} 0
# HELP huatuo_bamai_memory_vmstat_container_unevictable cgroup memory.stat unevictable
# TYPE huatuo_bamai_memory_vmstat_container_unevictable gauge
huatuo_bamai_memory_vmstat_container_unevictable{container_host="coredns-855c4dd65d-8v5kg",container_hostnamespace="kube-system",container_level="burstable",container_name="coredns",container_type="normal",host="hostname",region="dev"} 0
| Metric | Description | Unit | Target | Labels |
|---|---|---|---|---|
| memory_vmstat_container_active_file | Active file-backed memory | Bytes | Container | container_host, container_hostnamespace, container_level, container_name, container_type, host, region |
| memory_vmstat_container_active_anon | Active anonymous memory | Bytes | Container | container_host, container_hostnamespace, container_level, container_name, container_type, host, region |
| memory_vmstat_container_inactive_file | Inactive file-backed memory | Bytes | Container | container_host, container_hostnamespace, container_level, container_name, container_type, host, region |
| memory_vmstat_container_inactive_anon | Inactive anonymous memory | Bytes | Container | container_host, container_hostnamespace, container_level, container_name, container_type, host, region |
| memory_vmstat_container_file_dirty | Dirty file pages not yet written back | Bytes | Container | container_host, container_hostnamespace, container_level, container_name, container_type, host, region |
| memory_vmstat_container_file_writeback | File pages currently being written back | Bytes | Container | container_host, container_hostnamespace, container_level, container_name, container_type, host, region |
| memory_vmstat_container_unevictable | Unevictable pages (mlocked, hugetlbfs, etc.) | Bytes | Container | container_host, container_hostnamespace, container_level, container_name, container_type, host, region |
| … (pgscan_direct, pgsteal_kswapd, etc.) | Standard vmstat reclaim / scanning counters | Bytes | Container | container_host, container_hostnamespace, container_level, container_name, container_type, host, region |
Host memory state.
# HELP huatuo_bamai_memory_vmstat_allocstall_device /proc/vmstat allocstall_device
# TYPE huatuo_bamai_memory_vmstat_allocstall_device gauge
huatuo_bamai_memory_vmstat_allocstall_device{host="hostname",region="dev"} 0
# HELP huatuo_bamai_memory_vmstat_allocstall_dma /proc/vmstat allocstall_dma
# TYPE huatuo_bamai_memory_vmstat_allocstall_dma gauge
huatuo_bamai_memory_vmstat_allocstall_dma{host="hostname",region="dev"} 0
# HELP huatuo_bamai_memory_vmstat_allocstall_dma32 /proc/vmstat allocstall_dma32
# TYPE huatuo_bamai_memory_vmstat_allocstall_dma32 gauge
huatuo_bamai_memory_vmstat_allocstall_dma32{host="hostname",region="dev"} 0
# HELP huatuo_bamai_memory_vmstat_allocstall_movable /proc/vmstat allocstall_movable
# TYPE huatuo_bamai_memory_vmstat_allocstall_movable gauge
huatuo_bamai_memory_vmstat_allocstall_movable{host="hostname",region="dev"} 0
# HELP huatuo_bamai_memory_vmstat_allocstall_normal /proc/vmstat allocstall_normal
# TYPE huatuo_bamai_memory_vmstat_allocstall_normal gauge
huatuo_bamai_memory_vmstat_allocstall_normal{host="hostname",region="dev"} 0
# HELP huatuo_bamai_memory_vmstat_nr_active_anon /proc/vmstat nr_active_anon
# TYPE huatuo_bamai_memory_vmstat_nr_active_anon gauge
huatuo_bamai_memory_vmstat_nr_active_anon{host="hostname",region="dev"} 155449
# HELP huatuo_bamai_memory_vmstat_nr_active_file /proc/vmstat nr_active_file
# TYPE huatuo_bamai_memory_vmstat_nr_active_file gauge
huatuo_bamai_memory_vmstat_nr_active_file{host="hostname",region="dev"} 212425
# HELP huatuo_bamai_memory_vmstat_nr_dirty /proc/vmstat nr_dirty
# TYPE huatuo_bamai_memory_vmstat_nr_dirty gauge
huatuo_bamai_memory_vmstat_nr_dirty{host="hostname",region="dev"} 19047
# HELP huatuo_bamai_memory_vmstat_nr_dirty_background_threshold /proc/vmstat nr_dirty_background_threshold
# TYPE huatuo_bamai_memory_vmstat_nr_dirty_background_threshold gauge
huatuo_bamai_memory_vmstat_nr_dirty_background_threshold{host="hostname",region="dev"} 379858
# HELP huatuo_bamai_memory_vmstat_nr_dirty_threshold /proc/vmstat nr_dirty_threshold
# TYPE huatuo_bamai_memory_vmstat_nr_dirty_threshold gauge
huatuo_bamai_memory_vmstat_nr_dirty_threshold{host="hostname",region="dev"} 760646
# HELP huatuo_bamai_memory_vmstat_nr_free_pages /proc/vmstat nr_free_pages
# TYPE huatuo_bamai_memory_vmstat_nr_free_pages gauge
huatuo_bamai_memory_vmstat_nr_free_pages{host="hostname",region="dev"} 3.20535e+06
# HELP huatuo_bamai_memory_vmstat_nr_inactive_anon /proc/vmstat nr_inactive_anon
# TYPE huatuo_bamai_memory_vmstat_nr_inactive_anon gauge
huatuo_bamai_memory_vmstat_nr_inactive_anon{host="hostname",region="dev"} 0
# HELP huatuo_bamai_memory_vmstat_nr_inactive_file /proc/vmstat nr_inactive_file
# TYPE huatuo_bamai_memory_vmstat_nr_inactive_file gauge
huatuo_bamai_memory_vmstat_nr_inactive_file{host="hostname",region="dev"} 428518
# HELP huatuo_bamai_memory_vmstat_nr_mlock /proc/vmstat nr_mlock
# TYPE huatuo_bamai_memory_vmstat_nr_mlock gauge
huatuo_bamai_memory_vmstat_nr_mlock{host="hostname",region="dev"} 6821
# HELP huatuo_bamai_memory_vmstat_nr_shmem /proc/vmstat nr_shmem
# TYPE huatuo_bamai_memory_vmstat_nr_shmem gauge
huatuo_bamai_memory_vmstat_nr_shmem{host="hostname",region="dev"} 541
# HELP huatuo_bamai_memory_vmstat_nr_shmem_hugepages /proc/vmstat nr_shmem_hugepages
# TYPE huatuo_bamai_memory_vmstat_nr_shmem_hugepages gauge
huatuo_bamai_memory_vmstat_nr_shmem_hugepages{host="hostname",region="dev"} 0
# HELP huatuo_bamai_memory_vmstat_nr_shmem_pmdmapped /proc/vmstat nr_shmem_pmdmapped
# TYPE huatuo_bamai_memory_vmstat_nr_shmem_pmdmapped gauge
huatuo_bamai_memory_vmstat_nr_shmem_pmdmapped{host="hostname",region="dev"} 0
# HELP huatuo_bamai_memory_vmstat_nr_slab_reclaimable /proc/vmstat nr_slab_reclaimable
# TYPE huatuo_bamai_memory_vmstat_nr_slab_reclaimable gauge
huatuo_bamai_memory_vmstat_nr_slab_reclaimable{host="hostname",region="dev"} 22322
# HELP huatuo_bamai_memory_vmstat_nr_slab_unreclaimable /proc/vmstat nr_slab_unreclaimable
# TYPE huatuo_bamai_memory_vmstat_nr_slab_unreclaimable gauge
huatuo_bamai_memory_vmstat_nr_slab_unreclaimable{host="hostname",region="dev"} 24168
# HELP huatuo_bamai_memory_vmstat_nr_unevictable /proc/vmstat nr_unevictable
# TYPE huatuo_bamai_memory_vmstat_nr_unevictable gauge
huatuo_bamai_memory_vmstat_nr_unevictable{host="hostname",region="dev"} 6839
# HELP huatuo_bamai_memory_vmstat_nr_writeback /proc/vmstat nr_writeback
# TYPE huatuo_bamai_memory_vmstat_nr_writeback gauge
huatuo_bamai_memory_vmstat_nr_writeback{host="hostname",region="dev"} 0
# HELP huatuo_bamai_memory_vmstat_nr_writeback_temp /proc/vmstat nr_writeback_temp
# TYPE huatuo_bamai_memory_vmstat_nr_writeback_temp gauge
huatuo_bamai_memory_vmstat_nr_writeback_temp{host="hostname",region="dev"} 0
# HELP huatuo_bamai_memory_vmstat_numa_pages_migrated /proc/vmstat numa_pages_migrated
# TYPE huatuo_bamai_memory_vmstat_numa_pages_migrated gauge
huatuo_bamai_memory_vmstat_numa_pages_migrated{host="hostname",region="dev"} 0
# HELP huatuo_bamai_memory_vmstat_pgdeactivate /proc/vmstat pgdeactivate
# TYPE huatuo_bamai_memory_vmstat_pgdeactivate gauge
huatuo_bamai_memory_vmstat_pgdeactivate{host="hostname",region="dev"} 0
# HELP huatuo_bamai_memory_vmstat_pgrefill /proc/vmstat pgrefill
# TYPE huatuo_bamai_memory_vmstat_pgrefill gauge
huatuo_bamai_memory_vmstat_pgrefill{host="hostname",region="dev"} 0
# HELP huatuo_bamai_memory_vmstat_pgscan_direct /proc/vmstat pgscan_direct
# TYPE huatuo_bamai_memory_vmstat_pgscan_direct gauge
huatuo_bamai_memory_vmstat_pgscan_direct{host="hostname",region="dev"} 0
# HELP huatuo_bamai_memory_vmstat_pgscan_direct_throttle /proc/vmstat pgscan_direct_throttle
# TYPE huatuo_bamai_memory_vmstat_pgscan_direct_throttle gauge
huatuo_bamai_memory_vmstat_pgscan_direct_throttle{host="hostname",region="dev"} 0
# HELP huatuo_bamai_memory_vmstat_pgscan_kswapd /proc/vmstat pgscan_kswapd
# TYPE huatuo_bamai_memory_vmstat_pgscan_kswapd gauge
huatuo_bamai_memory_vmstat_pgscan_kswapd{host="hostname",region="dev"} 0
# HELP huatuo_bamai_memory_vmstat_pgsteal_direct /proc/vmstat pgsteal_direct
# TYPE huatuo_bamai_memory_vmstat_pgsteal_direct gauge
huatuo_bamai_memory_vmstat_pgsteal_direct{host="hostname",region="dev"} 0
# HELP huatuo_bamai_memory_vmstat_pgsteal_kswapd /proc/vmstat pgsteal_kswapd
# TYPE huatuo_bamai_memory_vmstat_pgsteal_kswapd gauge
huatuo_bamai_memory_vmstat_pgsteal_kswapd{host="hostname",region="dev"} 0
Standard kernel vmstat counters (see kernel documentation for full details):
- nr_free_pages: total free pages in buddy allocator
- nr_active_anon / nr_inactive_anon: active / inactive anonymous pages
- nr_active_file / nr_inactive_file: active / inactive file pages
- nr_dirty / nr_writeback: dirty / under writeback pages
- nr_dirty_threshold / nr_dirty_background_threshold: dirty page writeback thresholds
- pgscan_kswapd / pgsteal_kswapd / … : reclaim & scanning statistics
- allocstall_*: stalls due to allocation failure in different zones
- numa_hit / numa_miss / numa_foreign / numa_local / numa_other: NUMA allocation statistics
Ref:
- https://docs.kernel.org/admin-guide/cgroup-v2.html
- https://docs.kernel.org/admin-guide/cgroup-v1/memory.html
- https://docs.kernel.org/admin-guide/mm/transhuge.html
Events
From memory.events:
# HELP huatuo_bamai_memory_events_container_high memory events high
# TYPE huatuo_bamai_memory_events_container_high gauge
huatuo_bamai_memory_events_container_high{container_host="coredns-855c4dd65d-8v5kg",container_hostnamespace="kube-system",container_level="burstable",container_name="coredns",container_type="normal",host="hostname",region="dev"} 0
# HELP huatuo_bamai_memory_events_container_low memory events low
# TYPE huatuo_bamai_memory_events_container_low gauge
huatuo_bamai_memory_events_container_low{container_host="coredns-855c4dd65d-8v5kg",container_hostnamespace="kube-system",container_level="burstable",container_name="coredns",container_type="normal",host="hostname",region="dev"} 0
# HELP huatuo_bamai_memory_events_container_max memory events max
# TYPE huatuo_bamai_memory_events_container_max gauge
huatuo_bamai_memory_events_container_max{container_host="coredns-855c4dd65d-8v5kg",container_hostnamespace="kube-system",container_level="burstable",container_name="coredns",container_type="normal",host="hostname",region="dev"} 0
# HELP huatuo_bamai_memory_events_container_oom memory events oom
# TYPE huatuo_bamai_memory_events_container_oom gauge
huatuo_bamai_memory_events_container_oom{container_host="coredns-855c4dd65d-8v5kg",container_hostnamespace="kube-system",container_level="burstable",container_name="coredns",container_type="normal",host="hostname",region="dev"} 0
# HELP huatuo_bamai_memory_events_container_oom_group_kill memory events oom_group_kill
# TYPE huatuo_bamai_memory_events_container_oom_group_kill gauge
huatuo_bamai_memory_events_container_oom_group_kill{container_host="coredns-855c4dd65d-8v5kg",container_hostnamespace="kube-system",container_level="burstable",container_name="coredns",container_type="normal",host="hostname",region="dev"} 0
# HELP huatuo_bamai_memory_events_container_oom_kill memory events oom_kill
# TYPE huatuo_bamai_memory_events_container_oom_kill gauge
huatuo_bamai_memory_events_container_oom_kill{container_host="coredns-855c4dd65d-8v5kg",container_hostnamespace="kube-system",container_level="burstable",container_name="coredns",container_type="normal",host="hostname",region="dev"} 0
| Metric | Description | Unit | Target | Labels |
|---|---|---|---|---|
| memory_events_container_low | Pages reclaimed below memory.low due to system pressure | count | Container | container_host, container_hostnamespace, container_level, container_name, container_type, host, region |
| memory_events_container_high | Times usage exceeded memory.high (throttling / direct reclaim triggered) | count | Container | container_host, container_hostnamespace, container_level, container_name, container_type, host, region |
| memory_events_container_max | Times approaching or hitting memory.max | count | Container | container_host, container_hostnamespace, container_level, container_name, container_type, host, region |
| memory_events_container_oom | Times OOM path entered due to memory.max | count | Container | container_host, container_hostnamespace, container_level, container_name, container_type, host, region |
| memory_events_container_oom_kill | Number of processes killed by OOM killer in cgroup | count | Container | container_host, container_hostnamespace, container_level, container_name, container_type, host, region |
| memory_events_container_oom_group_kill | Number of times entire cgroup killed by OOM | count | Container | container_host, container_hostnamespace, container_level, container_name, container_type, host, region |
Buddyinfo
Free page block distribution per node/zone/order (from /proc/buddyinfo):
# HELP huatuo_bamai_memory_buddyinfo_blocks buddy info
# TYPE huatuo_bamai_memory_buddyinfo_blocks gauge
huatuo_bamai_memory_buddyinfo_blocks{host="hostname",node="0",order="0",region="dev",zone="DMA"} 0
huatuo_bamai_memory_buddyinfo_blocks{host="hostname",node="0",order="0",region="dev",zone="DMA32"} 3
huatuo_bamai_memory_buddyinfo_blocks{host="hostname",node="0",order="0",region="dev",zone="Normal"} 7
huatuo_bamai_memory_buddyinfo_blocks{host="hostname",node="0",order="1",region="dev",zone="DMA"} 0
huatuo_bamai_memory_buddyinfo_blocks{host="hostname",node="0",order="1",region="dev",zone="DMA32"} 1
huatuo_bamai_memory_buddyinfo_blocks{host="hostname",node="0",order="1",region="dev",zone="Normal"} 36
huatuo_bamai_memory_buddyinfo_blocks{host="hostname",node="0",order="10",region="dev",zone="DMA"} 2
huatuo_bamai_memory_buddyinfo_blocks{host="hostname",node="0",order="10",region="dev",zone="DMA32"} 743
huatuo_bamai_memory_buddyinfo_blocks{host="hostname",node="0",order="10",region="dev",zone="Normal"} 2265
huatuo_bamai_memory_buddyinfo_blocks{host="hostname",node="0",order="2",region="dev",zone="DMA"} 0
huatuo_bamai_memory_buddyinfo_blocks{host="hostname",node="0",order="2",region="dev",zone="DMA32"} 3
huatuo_bamai_memory_buddyinfo_blocks{host="hostname",node="0",order="2",region="dev",zone="Normal"} 10
huatuo_bamai_memory_buddyinfo_blocks{host="hostname",node="0",order="3",region="dev",zone="DMA"} 0
huatuo_bamai_memory_buddyinfo_blocks{host="hostname",node="0",order="3",region="dev",zone="DMA32"} 2
huatuo_bamai_memory_buddyinfo_blocks{host="hostname",node="0",order="3",region="dev",zone="Normal"} 224
huatuo_bamai_memory_buddyinfo_blocks{host="hostname",node="0",order="4",region="dev",zone="DMA"} 0
huatuo_bamai_memory_buddyinfo_blocks{host="hostname",node="0",order="4",region="dev",zone="DMA32"} 1
huatuo_bamai_memory_buddyinfo_blocks{host="hostname",node="0",order="4",region="dev",zone="Normal"} 376
huatuo_bamai_memory_buddyinfo_blocks{host="hostname",node="0",order="5",region="dev",zone="DMA"} 0
huatuo_bamai_memory_buddyinfo_blocks{host="hostname",node="0",order="5",region="dev",zone="DMA32"} 1
huatuo_bamai_memory_buddyinfo_blocks{host="hostname",node="0",order="5",region="dev",zone="Normal"} 165
huatuo_bamai_memory_buddyinfo_blocks{host="hostname",node="0",order="6",region="dev",zone="DMA"} 0
huatuo_bamai_memory_buddyinfo_blocks{host="hostname",node="0",order="6",region="dev",zone="DMA32"} 3
huatuo_bamai_memory_buddyinfo_blocks{host="hostname",node="0",order="6",region="dev",zone="Normal"} 118
huatuo_bamai_memory_buddyinfo_blocks{host="hostname",node="0",order="7",region="dev",zone="DMA"} 0
huatuo_bamai_memory_buddyinfo_blocks{host="hostname",node="0",order="7",region="dev",zone="DMA32"} 4
huatuo_bamai_memory_buddyinfo_blocks{host="hostname",node="0",order="7",region="dev",zone="Normal"} 172
huatuo_bamai_memory_buddyinfo_blocks{host="hostname",node="0",order="8",region="dev",zone="DMA"} 1
huatuo_bamai_memory_buddyinfo_blocks{host="hostname",node="0",order="8",region="dev",zone="DMA32"} 4
huatuo_bamai_memory_buddyinfo_blocks{host="hostname",node="0",order="8",region="dev",zone="Normal"} 35
huatuo_bamai_memory_buddyinfo_blocks{host="hostname",node="0",order="9",region="dev",zone="DMA"} 2
huatuo_bamai_memory_buddyinfo_blocks{host="hostname",node="0",order="9",region="dev",zone="DMA32"} 4
huatuo_bamai_memory_buddyinfo_blocks{host="hostname",node="0",order="9",region="dev",zone="Normal"} 25
| Metric | Description | Unit | Target | Labels |
|---|---|---|---|---|
| memory_buddyinfo_blocks | Shows number of free blocks of each order (2^order pages) in each zone. | count | Host | procfs |
Network
ARP
# HELP huatuo_bamai_arp_container_entries arp entries in container netns
# TYPE huatuo_bamai_arp_container_entries gauge
huatuo_bamai_arp_container_entries{container_host="coredns-855c4dd65d-8v5kg",container_hostnamespace="kube-system",container_level="burstable",container_name="coredns",container_type="normal",host="hostname",region="dev"} 1
# HELP huatuo_bamai_arp_entries host init namespace
# TYPE huatuo_bamai_arp_entries gauge
huatuo_bamai_arp_entries{host="hostname",region="dev"} 5
# HELP huatuo_bamai_arp_total all entries in arp_cache for containers and host netns
# TYPE huatuo_bamai_arp_total gauge
huatuo_bamai_arp_total{host="hostname",region="dev"} 12
| Metric | Description | Unit | Scope | Labels |
|---|---|---|---|---|
| arp_entries | Number of ARP entries in the host’s network namespace | count | Host namespace | host, region |
| arp_total | Total number of ARP entries across all network namespaces on the host | count | Host | host, region |
| arp_container_entries | Number of ARP entries in the container’s network namespace | count | Container | container_host, container_hostnamespace, container_level, container_name, container_type, host, region |
Qdisc
Qdisc (Queueing Discipline) is a key module in the Linux kernel networking subsystem. Monitoring this module provides clear visibility into network packet processing and latency behavior.
# HELP huatuo_bamai_netdev_qdisc_backlog Number of bytes currently in queue to be sent.
# TYPE huatuo_bamai_netdev_qdisc_backlog gauge
huatuo_bamai_netdev_qdisc_backlog{device="ens2",host="hostname",kind="fq_codel",region="dev"} 0
# HELP huatuo_bamai_netdev_qdisc_bytes_total Number of bytes sent.
# TYPE huatuo_bamai_netdev_qdisc_bytes_total counter
huatuo_bamai_netdev_qdisc_bytes_total{device="ens2",host="hostname",kind="fq_codel",region="dev"} 2.578235443e+09
# HELP huatuo_bamai_netdev_qdisc_current_queue_length Number of packets currently in queue to be sent.
# TYPE huatuo_bamai_netdev_qdisc_current_queue_length gauge
huatuo_bamai_netdev_qdisc_current_queue_length{device="ens2",host="hostname",kind="fq_codel",region="dev"} 0
# HELP huatuo_bamai_netdev_qdisc_drops_total Number of packet drops.
# TYPE huatuo_bamai_netdev_qdisc_drops_total counter
huatuo_bamai_netdev_qdisc_drops_total{device="ens2",host="hostname",kind="fq_codel",region="dev"} 0
# HELP huatuo_bamai_netdev_qdisc_overlimits_total Number of packet overlimits.
# TYPE huatuo_bamai_netdev_qdisc_overlimits_total counter
huatuo_bamai_netdev_qdisc_overlimits_total{device="ens2",host="hostname",kind="fq_codel",region="dev"} 0
# HELP huatuo_bamai_netdev_qdisc_packets_total Number of packets sent.
# TYPE huatuo_bamai_netdev_qdisc_packets_total counter
huatuo_bamai_netdev_qdisc_packets_total{device="ens2",host="hostname",kind="fq_codel",region="dev"} 6.867714e+06
# HELP huatuo_bamai_netdev_qdisc_requeues_total Number of packets dequeued, not transmitted, and requeued.
# TYPE huatuo_bamai_netdev_qdisc_requeues_total counter
huatuo_bamai_netdev_qdisc_requeues_total{device="ens2",host="hostname",kind="fq_codel",region="dev"} 0
| Metric | Description | Unit | Scope | Labels |
|---|---|---|---|---|
| qdisc_backlog | Bytes of packets currently queued for transmission (backlog) | Bytes | Host | device, host, kind, region |
| qdisc_current_queue_length | Number of packets currently queued | count | Host | device, host, kind, region |
| qdisc_overlimits_total | Total number of times the queue limit was exceeded | count | Host | device, host, kind, region |
| qdisc_requeues_total | Number of times packets were requeued due to temporary inability of the NIC/driver to transmit | count | Host | device, host, kind, region |
| qdisc_drops_total | Total number of packets actively dropped | count | Host | device, host, kind, region |
| qdisc_bytes_total | Total bytes transmitted | Bytes | Host | device, host, kind, region |
| qdisc_packets_total | Total number of packets transmitted | count | Host | device, host, kind, region |
Hardware
This metric tracks packets dropped by the network interface card (NIC) hardware in the receive (RX) path, typically due to buffer overflow, CRC errors, or other hardware-level issues.
# HELP huatuo_bamai_netdev_hw_rx_dropped count of packets dropped at hardware level
# TYPE huatuo_bamai_netdev_hw_rx_dropped gauge
huatuo_bamai_netdev_hw_rx_dropped{device="eth0",driver="mlx5_core",host="hostname",region="dev"} 0
| Metric | Description | Unit | Scope | Labels |
|---|---|---|---|---|
| netdev_hw_rx_dropped | Number of packets dropped by NIC hardware in the receive direction | count | Host | eBPF |
Netdev
# HELP huatuo_bamai_netdev_container_receive_bytes_total Network device statistic receive_bytes.
# TYPE huatuo_bamai_netdev_container_receive_bytes_total counter
huatuo_bamai_netdev_container_receive_bytes_total{container_host="coredns-855c4dd65d-8v5kg",container_hostnamespace="kube-system",container_level="burstable",container_name="coredns",container_type="normal",device="eth0",host="hostname",region="dev"} 6.4400018e+07
# HELP huatuo_bamai_netdev_container_receive_compressed_total Network device statistic receive_compressed.
# TYPE huatuo_bamai_netdev_container_receive_compressed_total counter
huatuo_bamai_netdev_container_receive_compressed_total{container_host="coredns-855c4dd65d-8v5kg",container_hostnamespace="kube-system",container_level="burstable",container_name="coredns",container_type="normal",device="eth0",host="hostname",region="dev"} 0
# HELP huatuo_bamai_netdev_container_receive_dropped_total Network device statistic receive_dropped.
# TYPE huatuo_bamai_netdev_container_receive_dropped_total counter
huatuo_bamai_netdev_container_receive_dropped_total{container_host="coredns-855c4dd65d-8v5kg",container_hostnamespace="kube-system",container_level="burstable",container_name="coredns",container_type="normal",device="eth0",host="hostname",region="dev"} 0
# HELP huatuo_bamai_netdev_container_receive_errors_total Network device statistic receive_errors.
# TYPE huatuo_bamai_netdev_container_receive_errors_total counter
huatuo_bamai_netdev_container_receive_errors_total{container_host="coredns-855c4dd65d-8v5kg",container_hostnamespace="kube-system",container_level="burstable",container_name="coredns",container_type="normal",device="eth0",host="hostname",region="dev"} 0
# HELP huatuo_bamai_netdev_container_receive_fifo_total Network device statistic receive_fifo.
# TYPE huatuo_bamai_netdev_container_receive_fifo_total counter
huatuo_bamai_netdev_container_receive_fifo_total{container_host="coredns-855c4dd65d-8v5kg",container_hostnamespace="kube-system",container_level="burstable",container_name="coredns",container_type="normal",device="eth0",host="hostname",region="dev"} 0
# HELP huatuo_bamai_netdev_container_receive_frame_total Network device statistic receive_frame.
# TYPE huatuo_bamai_netdev_container_receive_frame_total counter
huatuo_bamai_netdev_container_receive_frame_total{container_host="coredns-855c4dd65d-8v5kg",container_hostnamespace="kube-system",container_level="burstable",container_name="coredns",container_type="normal",device="eth0",host="hostname",region="dev"} 0
# HELP huatuo_bamai_netdev_container_receive_multicast_total Network device statistic receive_multicast.
# TYPE huatuo_bamai_netdev_container_receive_multicast_total counter
huatuo_bamai_netdev_container_receive_multicast_total{container_host="coredns-855c4dd65d-8v5kg",container_hostnamespace="kube-system",container_level="burstable",container_name="coredns",container_type="normal",device="eth0",host="hostname",region="dev"} 0
# HELP huatuo_bamai_netdev_container_receive_packets_total Network device statistic receive_packets.
# TYPE huatuo_bamai_netdev_container_receive_packets_total counter
huatuo_bamai_netdev_container_receive_packets_total{container_host="coredns-855c4dd65d-8v5kg",container_hostnamespace="kube-system",container_level="burstable",container_name="coredns",container_type="normal",device="eth0",host="hostname",region="dev"} 693155
# HELP huatuo_bamai_netdev_container_transmit_bytes_total Network device statistic transmit_bytes.
# TYPE huatuo_bamai_netdev_container_transmit_bytes_total counter
huatuo_bamai_netdev_container_transmit_bytes_total{container_host="coredns-855c4dd65d-8v5kg",container_hostnamespace="kube-system",container_level="burstable",container_name="coredns",container_type="normal",device="eth0",host="hostname",region="dev"} 6.2347911e+07
# HELP huatuo_bamai_netdev_container_transmit_carrier_total Network device statistic transmit_carrier.
# TYPE huatuo_bamai_netdev_container_transmit_carrier_total counter
huatuo_bamai_netdev_container_transmit_carrier_total{container_host="coredns-855c4dd65d-8v5kg",container_hostnamespace="kube-system",container_level="burstable",container_name="coredns",container_type="normal",device="eth0",host="hostname",region="dev"} 0
# HELP huatuo_bamai_netdev_container_transmit_colls_total Network device statistic transmit_colls.
# TYPE huatuo_bamai_netdev_container_transmit_colls_total counter
huatuo_bamai_netdev_container_transmit_colls_total{container_host="coredns-855c4dd65d-8v5kg",container_hostnamespace="kube-system",container_level="burstable",container_name="coredns",container_type="normal",device="eth0",host="hostname",region="dev"} 0
# HELP huatuo_bamai_netdev_container_transmit_compressed_total Network device statistic transmit_compressed.
# TYPE huatuo_bamai_netdev_container_transmit_compressed_total counter
huatuo_bamai_netdev_container_transmit_compressed_total{container_host="coredns-855c4dd65d-8v5kg",container_hostnamespace="kube-system",container_level="burstable",container_name="coredns",container_type="normal",device="eth0",host="hostname",region="dev"} 0
# HELP huatuo_bamai_netdev_container_transmit_dropped_total Network device statistic transmit_dropped.
# TYPE huatuo_bamai_netdev_container_transmit_dropped_total counter
huatuo_bamai_netdev_container_transmit_dropped_total{container_host="coredns-855c4dd65d-8v5kg",container_hostnamespace="kube-system",container_level="burstable",container_name="coredns",container_type="normal",device="eth0",host="hostname",region="dev"} 0
# HELP huatuo_bamai_netdev_container_transmit_errors_total Network device statistic transmit_errors.
# TYPE huatuo_bamai_netdev_container_transmit_errors_total counter
huatuo_bamai_netdev_container_transmit_errors_total{container_host="coredns-855c4dd65d-8v5kg",container_hostnamespace="kube-system",container_level="burstable",container_name="coredns",container_type="normal",device="eth0",host="hostname",region="dev"} 0
# HELP huatuo_bamai_netdev_container_transmit_fifo_total Network device statistic transmit_fifo.
# TYPE huatuo_bamai_netdev_container_transmit_fifo_total counter
huatuo_bamai_netdev_container_transmit_fifo_total{container_host="coredns-855c4dd65d-8v5kg",container_hostnamespace="kube-system",container_level="burstable",container_name="coredns",container_type="normal",device="eth0",host="hostname",region="dev"} 0
# HELP huatuo_bamai_netdev_container_transmit_packets_total Network device statistic transmit_packets.
# TYPE huatuo_bamai_netdev_container_transmit_packets_total counter
huatuo_bamai_netdev_container_transmit_packets_total{container_host="coredns-855c4dd65d-8v5kg",container_hostnamespace="kube-system",container_level="burstable",container_name="coredns",container_type="normal",device="eth0",host="hostname",region="dev"} 660218
| Metric | Description | Unit | Scope | Labels |
|---|---|---|---|---|
| netdev_receive_bytes_total | Total number of bytes successfully received | count | Host, Container | container_host, container_hostnamespace, container_level, container_name, container_type, host, region |
| netdev_receive_packets_total | Total number of packets successfully received | count | Host, Container | container_host, container_hostnamespace, container_level, container_name, container_type, host, region |
| netdev_receive_compressed_total | Number of compressed packets received | count | Host, Container | container_host, container_hostnamespace, container_level, container_name, container_type, host, region |
| netdev_receive_frame_total | Number of frame alignment errors on receive | count | Host, Container | container_host, container_hostnamespace, container_level, container_name, container_type, host, region |
| netdev_receive_errors_total | Total number of receive errors | count | Host, Container | container_host, container_hostnamespace, container_level, container_name, container_type, host, region |
| netdev_receive_dropped_total | Number of received packets dropped by kernel or driver (various reasons) | count | Host, Container | container_host, container_hostnamespace, container_level, container_name, container_type, host, region |
| netdev_receive_fifo_total | Number of receive FIFO/ring buffer overflow errors | count | Host, Container | container_host, container_hostnamespace, container_level, container_name, container_type, host, region |
| netdev_transmit_bytes_total | Total number of bytes successfully transmitted | count | Host, Container | container_host, container_hostnamespace, container_level, container_name, container_type, host, region |
| netdev_transmit_packets_total | Total number of packets successfully transmitted | count | Host, Container | container_host, container_hostnamespace, container_level, container_name, container_type, host, region |
| netdev_transmit_errors_total | Total number of transmit errors | count | Host, Container | container_host, container_hostnamespace, container_level, container_name, container_type, host, region |
| netdev_transmit_dropped_total | Number of packets dropped during transmission (queue full, policy, etc.) | count | Host, Container | container_host, container_hostnamespace, container_level, container_name, container_type, host, region |
| netdev_transmit_fifo_total | Number of transmit FIFO/ring buffer errors | count | Host, Container | container_host, container_hostnamespace, container_level, container_name, container_type, host, region |
| netdev_transmit_carrier_total | Number of carrier errors (link down or cable issues during transmission) | count | Host, Container | container_host, container_hostnamespace, container_level, container_name, container_type, host, region |
| netdev_transmit_compressed_total | Number of compressed packets transmitted | count | Host, Container | container_host, container_hostnamespace, container_level, container_name, container_type, host, region |
Tcp Memory
From /proc/net/netstat
# HELP huatuo_bamai_tcp_memory_limit_pages tcp memory pages limit
# TYPE huatuo_bamai_tcp_memory_limit_pages gauge
huatuo_bamai_tcp_memory_limit_pages{host="hostname",region="dev"} 380526
# HELP huatuo_bamai_tcp_memory_usage_bytes tcp memory bytes usage
# TYPE huatuo_bamai_tcp_memory_usage_bytes gauge
huatuo_bamai_tcp_memory_usage_bytes{host="hostname",region="dev"} 0
# HELP huatuo_bamai_tcp_memory_usage_pages tcp memory pages usage
# TYPE huatuo_bamai_tcp_memory_usage_pages gauge
huatuo_bamai_tcp_memory_usage_pages{host="hostname",region="dev"} 0
# HELP huatuo_bamai_tcp_memory_usage_percent tcp memory usage percent
# TYPE huatuo_bamai_tcp_memory_usage_percent gauge
huatuo_bamai_tcp_memory_usage_percent{host="hostname",region="dev"} 0
TcpExt
Linux-specific TCP extended statistics (see kernel Documentation/networking/snmp_counter.rst):
- TcpExtListenDrops / ListenOverflows: drops due to full listen queue
- TcpExtSyncookiesSent / Recv / Failed: SYN cookies handling
- TcpExtTCPRcvCoalesce: packets coalesced in receive path
- TcpExtTCPAutoCorking: packets corked automatically
- TcpExtTCPOrigDataSent: original data bytes sent (excluding retransmits)
- TcpExtTCPLossProbes / TCPLossProbeRecovery: tail loss probe statistics
- TcpExtTCPAbortOn*: various abort reasons
- … (many more – refer to kernel snmp_counter documentation for complete list)
# HELP huatuo_bamai_netstat_container_TcpExt_ArpFilter statistic TcpExtArpFilter.
# TYPE huatuo_bamai_netstat_container_TcpExt_ArpFilter gauge
huatuo_bamai_netstat_container_TcpExt_ArpFilter{container_host="coredns-855c4dd65d-8v5kg",container_hostnamespace="kube-system",container_level="burstable",container_name="coredns",container_type="normal",host="hostname",region="dev"} 0
# HELP huatuo_bamai_netstat_container_TcpExt_BusyPollRxPackets statistic TcpExtBusyPollRxPackets.
# TYPE huatuo_bamai_netstat_container_TcpExt_BusyPollRxPackets gauge
huatuo_bamai_netstat_container_TcpExt_BusyPollRxPackets{container_host="coredns-855c4dd65d-8v5kg",container_hostnamespace="kube-system",container_level="burstable",container_name="coredns",container_type="normal",host="hostname",region="dev"} 0
# HELP huatuo_bamai_netstat_container_TcpExt_DelayedACKLocked statistic TcpExtDelayedACKLocked.
# TYPE huatuo_bamai_netstat_container_TcpExt_DelayedACKLocked gauge
huatuo_bamai_netstat_container_TcpExt_DelayedACKLocked{container_host="coredns-855c4dd65d-8v5kg",container_hostnamespace="kube-system",container_level="burstable",container_name="coredns",container_type="normal",host="hostname",region="dev"} 0
# HELP huatuo_bamai_netstat_container_TcpExt_DelayedACKLost statistic TcpExtDelayedACKLost.
# TYPE huatuo_bamai_netstat_container_TcpExt_DelayedACKLost gauge
huatuo_bamai_netstat_container_TcpExt_DelayedACKLost{container_host="coredns-855c4dd65d-8v5kg",container_hostnamespace="kube-system",container_level="burstable",container_name="coredns",container_type="normal",host="hostname",region="dev"} 0
# HELP huatuo_bamai_netstat_container_TcpExt_DelayedACKs statistic TcpExtDelayedACKs.
# TYPE huatuo_bamai_netstat_container_TcpExt_DelayedACKs gauge
huatuo_bamai_netstat_container_TcpExt_DelayedACKs{container_host="coredns-855c4dd65d-8v5kg",container_hostnamespace="kube-system",container_level="burstable",container_name="coredns",container_type="normal",host="hostname",region="dev"} 4650
# HELP huatuo_bamai_netstat_container_TcpExt_EmbryonicRsts statistic TcpExtEmbryonicRsts.
# TYPE huatuo_bamai_netstat_container_TcpExt_EmbryonicRsts gauge
huatuo_bamai_netstat_container_TcpExt_EmbryonicRsts{container_host="coredns-855c4dd65d-8v5kg",container_hostnamespace="kube-system",container_level="burstable",container_name="coredns",container_type="normal",host="hostname",region="dev"} 0
# HELP huatuo_bamai_netstat_container_TcpExt_IPReversePathFilter statistic TcpExtIPReversePathFilter.
# TYPE huatuo_bamai_netstat_container_TcpExt_IPReversePathFilter gauge
huatuo_bamai_netstat_container_TcpExt_IPReversePathFilter{container_host="coredns-855c4dd65d-8v5kg",container_hostnamespace="kube-system",container_level="burstable",container_name="coredns",container_type="normal",host="hostname",region="dev"} 0
# HELP huatuo_bamai_netstat_container_TcpExt_ListenDrops statistic TcpExtListenDrops.
# TYPE huatuo_bamai_netstat_container_TcpExt_ListenDrops gauge
huatuo_bamai_netstat_container_TcpExt_ListenDrops{container_host="coredns-855c4dd65d-8v5kg",container_hostnamespace="kube-system",container_level="burstable",container_name="coredns",container_type="normal",host="hostname",region="dev"} 0
# HELP huatuo_bamai_netstat_container_TcpExt_ListenOverflows statistic TcpExtListenOverflows.
# TYPE huatuo_bamai_netstat_container_TcpExt_ListenOverflows gauge
huatuo_bamai_netstat_container_TcpExt_ListenOverflows{container_host="coredns-855c4dd65d-8v5kg",container_hostnamespace="kube-system",container_level="burstable",container_name="coredns",container_type="normal",host="hostname",region="dev"} 0
# HELP huatuo_bamai_netstat_container_TcpExt_LockDroppedIcmps statistic TcpExtLockDroppedIcmps.
# TYPE huatuo_bamai_netstat_container_TcpExt_LockDroppedIcmps gauge
huatuo_bamai_netstat_container_TcpExt_LockDroppedIcmps{container_host="coredns-855c4dd65d-8v5kg",container_hostnamespace="kube-system",container_level="burstable",container_name="coredns",container_type="normal",host="hostname",region="dev"} 0
# HELP huatuo_bamai_netstat_container_TcpExt_OfoPruned statistic TcpExtOfoPruned.
# TYPE huatuo_bamai_netstat_container_TcpExt_OfoPruned gauge
huatuo_bamai_netstat_container_TcpExt_OfoPruned{container_host="coredns-855c4dd65d-8v5kg",container_hostnamespace="kube-system",container_level="burstable",container_name="coredns",container_type="normal",host="hostname",region="dev"} 0
# HELP huatuo_bamai_netstat_container_TcpExt_OutOfWindowIcmps statistic TcpExtOutOfWindowIcmps.
# TYPE huatuo_bamai_netstat_container_TcpExt_OutOfWindowIcmps gauge
huatuo_bamai_netstat_container_TcpExt_OutOfWindowIcmps{container_host="coredns-855c4dd65d-8v5kg",container_hostnamespace="kube-system",container_level="burstable",container_name="coredns",container_type="normal",host="hostname",region="dev"} 0
# HELP huatuo_bamai_netstat_container_TcpExt_PAWSActive statistic TcpExtPAWSActive.
# TYPE huatuo_bamai_netstat_container_TcpExt_PAWSActive gauge
huatuo_bamai_netstat_container_TcpExt_PAWSActive{container_host="coredns-855c4dd65d-8v5kg",container_hostnamespace="kube-system",container_level="burstable",container_name="coredns",container_type="normal",host="hostname",region="dev"} 0
# HELP huatuo_bamai_netstat_container_TcpExt_PAWSEstab statistic TcpExtPAWSEstab.
# TYPE huatuo_bamai_netstat_container_TcpExt_PAWSEstab gauge
huatuo_bamai_netstat_container_TcpExt_PAWSEstab{container_host="coredns-855c4dd65d-8v5kg",container_hostnamespace="kube-system",container_level="burstable",container_name="coredns",container_type="normal",host="hostname",region="dev"} 0
# HELP huatuo_bamai_netstat_container_TcpExt_PFMemallocDrop statistic TcpExtPFMemallocDrop.
# TYPE huatuo_bamai_netstat_container_TcpExt_PFMemallocDrop gauge
huatuo_bamai_netstat_container_TcpExt_PFMemallocDrop{container_host="coredns-855c4dd65d-8v5kg",container_hostnamespace="kube-system",container_level="burstable",container_name="coredns",container_type="normal",host="hostname",region="dev"} 0
# HELP huatuo_bamai_netstat_container_TcpExt_PruneCalled statistic TcpExtPruneCalled.
# TYPE huatuo_bamai_netstat_container_TcpExt_PruneCalled gauge
huatuo_bamai_netstat_container_TcpExt_PruneCalled{container_host="coredns-855c4dd65d-8v5kg",container_hostnamespace="kube-system",container_level="burstable",container_name="coredns",container_type="normal",host="hostname",region="dev"} 0
# HELP huatuo_bamai_netstat_container_TcpExt_RcvPruned statistic TcpExtRcvPruned.
# TYPE huatuo_bamai_netstat_container_TcpExt_RcvPruned gauge
huatuo_bamai_netstat_container_TcpExt_RcvPruned{container_host="coredns-855c4dd65d-8v5kg",container_hostnamespace="kube-system",container_level="burstable",container_name="coredns",container_type="normal",host="hostname",region="dev"} 0
# HELP huatuo_bamai_netstat_container_TcpExt_SyncookiesFailed statistic TcpExtSyncookiesFailed.
# TYPE huatuo_bamai_netstat_container_TcpExt_SyncookiesFailed gauge
huatuo_bamai_netstat_container_TcpExt_SyncookiesFailed{container_host="coredns-855c4dd65d-8v5kg",container_hostnamespace="kube-system",container_level="burstable",container_name="coredns",container_type="normal",host="hostname",region="dev"} 0
# HELP huatuo_bamai_netstat_container_TcpExt_SyncookiesRecv statistic TcpExtSyncookiesRecv.
# TYPE huatuo_bamai_netstat_container_TcpExt_SyncookiesRecv gauge
huatuo_bamai_netstat_container_TcpExt_SyncookiesRecv{container_host="coredns-855c4dd65d-8v5kg",container_hostnamespace="kube-system",container_level="burstable",container_name="coredns",container_type="normal",host="hostname",region="dev"} 0
# HELP huatuo_bamai_netstat_container_TcpExt_SyncookiesSent statistic TcpExtSyncookiesSent.
# TYPE huatuo_bamai_netstat_container_TcpExt_SyncookiesSent gauge
huatuo_bamai_netstat_container_TcpExt_SyncookiesSent{container_host="coredns-855c4dd65d-8v5kg",container_hostnamespace="kube-system",container_level="burstable",container_name="coredns",container_type="normal",host="hostname",region="dev"} 0
# HELP huatuo_bamai_netstat_container_TcpExt_TCPACKSkippedChallenge statistic TcpExtTCPACKSkippedChallenge.
# TYPE huatuo_bamai_netstat_container_TcpExt_TCPACKSkippedChallenge gauge
huatuo_bamai_netstat_container_TcpExt_TCPACKSkippedChallenge{container_host="coredns-855c4dd65d-8v5kg",container_hostnamespace="kube-system",container_level="burstable",container_name="coredns",container_type="normal",host="hostname",region="dev"} 0
# HELP huatuo_bamai_netstat_container_TcpExt_TCPACKSkippedFinWait2 statistic TcpExtTCPACKSkippedFinWait2.
# TYPE huatuo_bamai_netstat_container_TcpExt_TCPACKSkippedFinWait2 gauge
huatuo_bamai_netstat_container_TcpExt_TCPACKSkippedFinWait2{container_host="coredns-855c4dd65d-8v5kg",container_hostnamespace="kube-system",container_level="burstable",container_name="coredns",container_type="normal",host="hostname",region="dev"} 0
# HELP huatuo_bamai_netstat_container_TcpExt_TCPACKSkippedPAWS statistic TcpExtTCPACKSkippedPAWS.
# TYPE huatuo_bamai_netstat_container_TcpExt_TCPACKSkippedPAWS gauge
huatuo_bamai_netstat_container_TcpExt_TCPACKSkippedPAWS{container_host="coredns-855c4dd65d-8v5kg",container_hostnamespace="kube-system",container_level="burstable",container_name="coredns",container_type="normal",host="hostname",region="dev"} 0
# HELP huatuo_bamai_netstat_container_TcpExt_TCPACKSkippedSeq statistic TcpExtTCPACKSkippedSeq.
# TYPE huatuo_bamai_netstat_container_TcpExt_TCPACKSkippedSeq gauge
huatuo_bamai_netstat_container_TcpExt_TCPACKSkippedSeq{container_host="coredns-855c4dd65d-8v5kg",container_hostnamespace="kube-system",container_level="burstable",container_name="coredns",container_type="normal",host="hostname",region="dev"} 0
# HELP huatuo_bamai_netstat_container_TcpExt_TCPACKSkippedSynRecv statistic TcpExtTCPACKSkippedSynRecv.
# TYPE huatuo_bamai_netstat_container_TcpExt_TCPACKSkippedSynRecv gauge
huatuo_bamai_netstat_container_TcpExt_TCPACKSkippedSynRecv{container_host="coredns-855c4dd65d-8v5kg",container_hostnamespace="kube-system",container_level="burstable",container_name="coredns",container_type="normal",host="hostname",region="dev"} 0
# HELP huatuo_bamai_netstat_container_TcpExt_TCPACKSkippedTimeWait statistic TcpExtTCPACKSkippedTimeWait.
# TYPE huatuo_bamai_netstat_container_TcpExt_TCPACKSkippedTimeWait gauge
huatuo_bamai_netstat_container_TcpExt_TCPACKSkippedTimeWait{container_host="coredns-855c4dd65d-8v5kg",container_hostnamespace="kube-system",container_level="burstable",container_name="coredns",container_type="normal",host="hostname",region="dev"} 0
# HELP huatuo_bamai_netstat_container_TcpExt_TCPAOBad statistic TcpExtTCPAOBad.
# TYPE huatuo_bamai_netstat_container_TcpExt_TCPAOBad gauge
huatuo_bamai_netstat_container_TcpExt_TCPAOBad{container_host="coredns-855c4dd65d-8v5kg",container_hostnamespace="kube-system",container_level="burstable",container_name="coredns",container_type="normal",host="hostname",region="dev"} 0
# HELP huatuo_bamai_netstat_container_TcpExt_TCPAODroppedIcmps statistic TcpExtTCPAODroppedIcmps.
# TYPE huatuo_bamai_netstat_container_TcpExt_TCPAODroppedIcmps gauge
huatuo_bamai_netstat_container_TcpExt_TCPAODroppedIcmps{container_host="coredns-855c4dd65d-8v5kg",container_hostnamespace="kube-system",container_level="burstable",container_name="coredns",container_type="normal",host="hostname",region="dev"} 0
# HELP huatuo_bamai_netstat_container_TcpExt_TCPAOGood statistic TcpExtTCPAOGood.
# TYPE huatuo_bamai_netstat_container_TcpExt_TCPAOGood gauge
huatuo_bamai_netstat_container_TcpExt_TCPAOGood{container_host="coredns-855c4dd65d-8v5kg",container_hostnamespace="kube-system",container_level="burstable",container_name="coredns",container_type="normal",host="hostname",region="dev"} 0
# HELP huatuo_bamai_netstat_container_TcpExt_TCPAOKeyNotFound statistic TcpExtTCPAOKeyNotFound.
# TYPE huatuo_bamai_netstat_container_TcpExt_TCPAOKeyNotFound gauge
huatuo_bamai_netstat_container_TcpExt_TCPAOKeyNotFound{container_host="coredns-855c4dd65d-8v5kg",container_hostnamespace="kube-system",container_level="burstable",container_name="coredns",container_type="normal",host="hostname",region="dev"} 0
# HELP huatuo_bamai_netstat_container_TcpExt_TCPAORequired statistic TcpExtTCPAORequired.
# TYPE huatuo_bamai_netstat_container_TcpExt_TCPAORequired gauge
huatuo_bamai_netstat_container_TcpExt_TCPAORequired{container_host="coredns-855c4dd65d-8v5kg",container_hostnamespace="kube-system",container_level="burstable",container_name="coredns",container_type="normal",host="hostname",region="dev"} 0
# HELP huatuo_bamai_netstat_container_TcpExt_TCPAbortFailed statistic TcpExtTCPAbortFailed.
# TYPE huatuo_bamai_netstat_container_TcpExt_TCPAbortFailed gauge
huatuo_bamai_netstat_container_TcpExt_TCPAbortFailed{container_host="coredns-855c4dd65d-8v5kg",container_hostnamespace="kube-system",container_level="burstable",container_name="coredns",container_type="normal",host="hostname",region="dev"} 0
# HELP huatuo_bamai_netstat_container_TcpExt_TCPAbortOnClose statistic TcpExtTCPAbortOnClose.
# TYPE huatuo_bamai_netstat_container_TcpExt_TCPAbortOnClose gauge
huatuo_bamai_netstat_container_TcpExt_TCPAbortOnClose{container_host="coredns-855c4dd65d-8v5kg",container_hostnamespace="kube-system",container_level="burstable",container_name="coredns",container_type="normal",host="hostname",region="dev"} 1
# HELP huatuo_bamai_netstat_container_TcpExt_TCPAbortOnData statistic TcpExtTCPAbortOnData.
# TYPE huatuo_bamai_netstat_container_TcpExt_TCPAbortOnData gauge
huatuo_bamai_netstat_container_TcpExt_TCPAbortOnData{container_host="coredns-855c4dd65d-8v5kg",container_hostnamespace="kube-system",container_level="burstable",container_name="coredns",container_type="normal",host="hostname",region="dev"} 0
# HELP huatuo_bamai_netstat_container_TcpExt_TCPAbortOnLinger statistic TcpExtTCPAbortOnLinger.
# TYPE huatuo_bamai_netstat_container_TcpExt_TCPAbortOnLinger gauge
huatuo_bamai_netstat_container_TcpExt_TCPAbortOnLinger{container_host="coredns-855c4dd65d-8v5kg",container_hostnamespace="kube-system",container_level="burstable",container_name="coredns",container_type="normal",host="hostname",region="dev"} 0
# HELP huatuo_bamai_netstat_container_TcpExt_TCPAbortOnMemory statistic TcpExtTCPAbortOnMemory.
# TYPE huatuo_bamai_netstat_container_TcpExt_TCPAbortOnMemory gauge
huatuo_bamai_netstat_container_TcpExt_TCPAbortOnMemory{container_host="coredns-855c4dd65d-8v5kg",container_hostnamespace="kube-system",container_level="burstable",container_name="coredns",container_type="normal",host="hostname",region="dev"} 0
# HELP huatuo_bamai_netstat_container_TcpExt_TCPAbortOnTimeout statistic TcpExtTCPAbortOnTimeout.
# TYPE huatuo_bamai_netstat_container_TcpExt_TCPAbortOnTimeout gauge
huatuo_bamai_netstat_container_TcpExt_TCPAbortOnTimeout{container_host="coredns-855c4dd65d-8v5kg",container_hostnamespace="kube-system",container_level="burstable",container_name="coredns",container_type="normal",host="hostname",region="dev"} 0
# HELP huatuo_bamai_netstat_container_TcpExt_TCPAckCompressed statistic TcpExtTCPAckCompressed.
# TYPE huatuo_bamai_netstat_container_TcpExt_TCPAckCompressed gauge
huatuo_bamai_netstat_container_TcpExt_TCPAckCompressed{container_host="coredns-855c4dd65d-8v5kg",container_hostnamespace="kube-system",container_level="burstable",container_name="coredns",container_type="normal",host="hostname",region="dev"} 0
# HELP huatuo_bamai_netstat_container_TcpExt_TCPAutoCorking statistic TcpExtTCPAutoCorking.
# TYPE huatuo_bamai_netstat_container_TcpExt_TCPAutoCorking gauge
huatuo_bamai_netstat_container_TcpExt_TCPAutoCorking{container_host="coredns-855c4dd65d-8v5kg",container_hostnamespace="kube-system",container_level="burstable",container_name="coredns",container_type="normal",host="hostname",region="dev"} 0
# HELP huatuo_bamai_netstat_container_TcpExt_TCPBacklogCoalesce statistic TcpExtTCPBacklogCoalesce.
# TYPE huatuo_bamai_netstat_container_TcpExt_TCPBacklogCoalesce gauge
huatuo_bamai_netstat_container_TcpExt_TCPBacklogCoalesce{container_host="coredns-855c4dd65d-8v5kg",container_hostnamespace="kube-system",container_level="burstable",container_name="coredns",container_type="normal",host="hostname",region="dev"} 3
# HELP huatuo_bamai_netstat_container_TcpExt_TCPBacklogDrop statistic TcpExtTCPBacklogDrop.
# TYPE huatuo_bamai_netstat_container_TcpExt_TCPBacklogDrop gauge
huatuo_bamai_netstat_container_TcpExt_TCPBacklogDrop{container_host="coredns-855c4dd65d-8v5kg",container_hostnamespace="kube-system",container_level="burstable",container_name="coredns",container_type="normal",host="hostname",region="dev"} 0
# HELP huatuo_bamai_netstat_container_TcpExt_TCPChallengeACK statistic TcpExtTCPChallengeACK.
# TYPE huatuo_bamai_netstat_container_TcpExt_TCPChallengeACK gauge
huatuo_bamai_netstat_container_TcpExt_TCPChallengeACK{container_host="coredns-855c4dd65d-8v5kg",container_hostnamespace="kube-system",container_level="burstable",container_name="coredns",container_type="normal",host="hostname",region="dev"} 0
# HELP huatuo_bamai_netstat_container_TcpExt_TCPDSACKIgnoredDubious statistic TcpExtTCPDSACKIgnoredDubious.
# TYPE huatuo_bamai_netstat_container_TcpExt_TCPDSACKIgnoredDubious gauge
huatuo_bamai_netstat_container_TcpExt_TCPDSACKIgnoredDubious{container_host="coredns-855c4dd65d-8v5kg",container_hostnamespace="kube-system",container_level="burstable",container_name="coredns",container_type="normal",host="hostname",region="dev"} 0
# HELP huatuo_bamai_netstat_container_TcpExt_TCPDSACKIgnoredNoUndo statistic TcpExtTCPDSACKIgnoredNoUndo.
# TYPE huatuo_bamai_netstat_container_TcpExt_TCPDSACKIgnoredNoUndo gauge
huatuo_bamai_netstat_container_TcpExt_TCPDSACKIgnoredNoUndo{container_host="coredns-855c4dd65d-8v5kg",container_hostnamespace="kube-system",container_level="burstable",container_name="coredns",container_type="normal",host="hostname",region="dev"} 1
# HELP huatuo_bamai_netstat_container_TcpExt_TCPDSACKIgnoredOld statistic TcpExtTCPDSACKIgnoredOld.
# TYPE huatuo_bamai_netstat_container_TcpExt_TCPDSACKIgnoredOld gauge
huatuo_bamai_netstat_container_TcpExt_TCPDSACKIgnoredOld{container_host="coredns-855c4dd65d-8v5kg",container_hostnamespace="kube-system",container_level="burstable",container_name="coredns",container_type="normal",host="hostname",region="dev"} 0
# HELP huatuo_bamai_netstat_container_TcpExt_TCPDSACKOfoRecv statistic TcpExtTCPDSACKOfoRecv.
# TYPE huatuo_bamai_netstat_container_TcpExt_TCPDSACKOfoRecv gauge
huatuo_bamai_netstat_container_TcpExt_TCPDSACKOfoRecv{container_host="coredns-855c4dd65d-8v5kg",container_hostnamespace="kube-system",container_level="burstable",container_name="coredns",container_type="normal",host="hostname",region="dev"} 0
# HELP huatuo_bamai_netstat_container_TcpExt_TCPDSACKOfoSent statistic TcpExtTCPDSACKOfoSent.
# TYPE huatuo_bamai_netstat_container_TcpExt_TCPDSACKOfoSent gauge
huatuo_bamai_netstat_container_TcpExt_TCPDSACKOfoSent{container_host="coredns-855c4dd65d-8v5kg",container_hostnamespace="kube-system",container_level="burstable",container_name="coredns",container_type="normal",host="hostname",region="dev"} 0
# HELP huatuo_bamai_netstat_container_TcpExt_TCPDSACKOldSent statistic TcpExtTCPDSACKOldSent.
# TYPE huatuo_bamai_netstat_container_TcpExt_TCPDSACKOldSent gauge
huatuo_bamai_netstat_container_TcpExt_TCPDSACKOldSent{container_host="coredns-855c4dd65d-8v5kg",container_hostnamespace="kube-system",container_level="burstable",container_name="coredns",container_type="normal",host="hostname",region="dev"} 0
# HELP huatuo_bamai_netstat_container_TcpExt_TCPDSACKRecv statistic TcpExtTCPDSACKRecv.
# TYPE huatuo_bamai_netstat_container_TcpExt_TCPDSACKRecv gauge
huatuo_bamai_netstat_container_TcpExt_TCPDSACKRecv{container_host="coredns-855c4dd65d-8v5kg",container_hostnamespace="kube-system",container_level="burstable",container_name="coredns",container_type="normal",host="hostname",region="dev"} 1
# HELP huatuo_bamai_netstat_container_TcpExt_TCPDSACKRecvSegs statistic TcpExtTCPDSACKRecvSegs.
# TYPE huatuo_bamai_netstat_container_TcpExt_TCPDSACKRecvSegs gauge
huatuo_bamai_netstat_container_TcpExt_TCPDSACKRecvSegs{container_host="coredns-855c4dd65d-8v5kg",container_hostnamespace="kube-system",container_level="burstable",container_name="coredns",container_type="normal",host="hostname",region="dev"} 1
# HELP huatuo_bamai_netstat_container_TcpExt_TCPDSACKUndo statistic TcpExtTCPDSACKUndo.
# TYPE huatuo_bamai_netstat_container_TcpExt_TCPDSACKUndo gauge
huatuo_bamai_netstat_container_TcpExt_TCPDSACKUndo{container_host="coredns-855c4dd65d-8v5kg",container_hostnamespace="kube-system",container_level="burstable",container_name="coredns",container_type="normal",host="hostname",region="dev"} 0
# HELP huatuo_bamai_netstat_container_TcpExt_TCPDeferAcceptDrop statistic TcpExtTCPDeferAcceptDrop.
# TYPE huatuo_bamai_netstat_container_TcpExt_TCPDeferAcceptDrop gauge
huatuo_bamai_netstat_container_TcpExt_TCPDeferAcceptDrop{container_host="coredns-855c4dd65d-8v5kg",container_hostnamespace="kube-system",container_level="burstable",container_name="coredns",container_type="normal",host="hostname",region="dev"} 0
# HELP huatuo_bamai_netstat_container_TcpExt_TCPDelivered statistic TcpExtTCPDelivered.
# TYPE huatuo_bamai_netstat_container_TcpExt_TCPDelivered gauge
huatuo_bamai_netstat_container_TcpExt_TCPDelivered{container_host="coredns-855c4dd65d-8v5kg",container_hostnamespace="kube-system",container_level="burstable",container_name="coredns",container_type="normal",host="hostname",region="dev"} 3.28098e+06
# HELP huatuo_bamai_netstat_container_TcpExt_TCPDeliveredCE statistic TcpExtTCPDeliveredCE.
# TYPE huatuo_bamai_netstat_container_TcpExt_TCPDeliveredCE gauge
huatuo_bamai_netstat_container_TcpExt_TCPDeliveredCE{container_host="coredns-855c4dd65d-8v5kg",container_hostnamespace="kube-system",container_level="burstable",container_name="coredns",container_type="normal",host="hostname",region="dev"} 0
# HELP huatuo_bamai_netstat_container_TcpExt_TCPFastOpenActive statistic TcpExtTCPFastOpenActive.
# TYPE huatuo_bamai_netstat_container_TcpExt_TCPFastOpenActive gauge
huatuo_bamai_netstat_container_TcpExt_TCPFastOpenActive{container_host="coredns-855c4dd65d-8v5kg",container_hostnamespace="kube-system",container_level="burstable",container_name="coredns",container_type="normal",host="hostname",region="dev"} 0
# HELP huatuo_bamai_netstat_container_TcpExt_TCPFastOpenActiveFail statistic TcpExtTCPFastOpenActiveFail.
# TYPE huatuo_bamai_netstat_container_TcpExt_TCPFastOpenActiveFail gauge
huatuo_bamai_netstat_container_TcpExt_TCPFastOpenActiveFail{container_host="coredns-855c4dd65d-8v5kg",container_hostnamespace="kube-system",container_level="burstable",container_name="coredns",container_type="normal",host="hostname",region="dev"} 0
# HELP huatuo_bamai_netstat_container_TcpExt_TCPFastOpenBlackhole statistic TcpExtTCPFastOpenBlackhole.
# TYPE huatuo_bamai_netstat_container_TcpExt_TCPFastOpenBlackhole gauge
huatuo_bamai_netstat_container_TcpExt_TCPFastOpenBlackhole{container_host="coredns-855c4dd65d-8v5kg",container_hostnamespace="kube-system",container_level="burstable",container_name="coredns",container_type="normal",host="hostname",region="dev"} 0
# HELP huatuo_bamai_netstat_container_TcpExt_TCPFastOpenCookieReqd statistic TcpExtTCPFastOpenCookieReqd.
# TYPE huatuo_bamai_netstat_container_TcpExt_TCPFastOpenCookieReqd gauge
huatuo_bamai_netstat_container_TcpExt_TCPFastOpenCookieReqd{container_host="coredns-855c4dd65d-8v5kg",container_hostnamespace="kube-system",container_level="burstable",container_name="coredns",container_type="normal",host="hostname",region="dev"} 0
# HELP huatuo_bamai_netstat_container_TcpExt_TCPFastOpenListenOverflow statistic TcpExtTCPFastOpenListenOverflow.
# TYPE huatuo_bamai_netstat_container_TcpExt_TCPFastOpenListenOverflow gauge
huatuo_bamai_netstat_container_TcpExt_TCPFastOpenListenOverflow{container_host="coredns-855c4dd65d-8v5kg",container_hostnamespace="kube-system",container_level="burstable",container_name="coredns",container_type="normal",host="hostname",region="dev"} 0
# HELP huatuo_bamai_netstat_container_TcpExt_TCPFastOpenPassive statistic TcpExtTCPFastOpenPassive.
# TYPE huatuo_bamai_netstat_container_TcpExt_TCPFastOpenPassive gauge
huatuo_bamai_netstat_container_TcpExt_TCPFastOpenPassive{container_host="coredns-855c4dd65d-8v5kg",container_hostnamespace="kube-system",container_level="burstable",container_name="coredns",container_type="normal",host="hostname",region="dev"} 0
# HELP huatuo_bamai_netstat_container_TcpExt_TCPFastOpenPassiveAltKey statistic TcpExtTCPFastOpenPassiveAltKey.
# TYPE huatuo_bamai_netstat_container_TcpExt_TCPFastOpenPassiveAltKey gauge
huatuo_bamai_netstat_container_TcpExt_TCPFastOpenPassiveAltKey{container_host="coredns-855c4dd65d-8v5kg",container_hostnamespace="kube-system",container_level="burstable",container_name="coredns",container_type="normal",host="hostname",region="dev"} 0
# HELP huatuo_bamai_netstat_container_TcpExt_TCPFastOpenPassiveFail statistic TcpExtTCPFastOpenPassiveFail.
# TYPE huatuo_bamai_netstat_container_TcpExt_TCPFastOpenPassiveFail gauge
huatuo_bamai_netstat_container_TcpExt_TCPFastOpenPassiveFail{container_host="coredns-855c4dd65d-8v5kg",container_hostnamespace="kube-system",container_level="burstable",container_name="coredns",container_type="normal",host="hostname",region="dev"} 0
# HELP huatuo_bamai_netstat_container_TcpExt_TCPFastRetrans statistic TcpExtTCPFastRetrans.
# TYPE huatuo_bamai_netstat_container_TcpExt_TCPFastRetrans gauge
huatuo_bamai_netstat_container_TcpExt_TCPFastRetrans{container_host="coredns-855c4dd65d-8v5kg",container_hostnamespace="kube-system",container_level="burstable",container_name="coredns",container_type="normal",host="hostname",region="dev"} 0
# HELP huatuo_bamai_netstat_container_TcpExt_TCPFromZeroWindowAdv statistic TcpExtTCPFromZeroWindowAdv.
# TYPE huatuo_bamai_netstat_container_TcpExt_TCPFromZeroWindowAdv gauge
huatuo_bamai_netstat_container_TcpExt_TCPFromZeroWindowAdv{container_host="coredns-855c4dd65d-8v5kg",container_hostnamespace="kube-system",container_level="burstable",container_name="coredns",container_type="normal",host="hostname",region="dev"} 0
# HELP huatuo_bamai_netstat_container_TcpExt_TCPFullUndo statistic TcpExtTCPFullUndo.
# TYPE huatuo_bamai_netstat_container_TcpExt_TCPFullUndo gauge
huatuo_bamai_netstat_container_TcpExt_TCPFullUndo{container_host="coredns-855c4dd65d-8v5kg",container_hostnamespace="kube-system",container_level="burstable",container_name="coredns",container_type="normal",host="hostname",region="dev"} 0
# HELP huatuo_bamai_netstat_container_TcpExt_TCPHPAcks statistic TcpExtTCPHPAcks.
# TYPE huatuo_bamai_netstat_container_TcpExt_TCPHPAcks gauge
huatuo_bamai_netstat_container_TcpExt_TCPHPAcks{container_host="coredns-855c4dd65d-8v5kg",container_hostnamespace="kube-system",container_level="burstable",container_name="coredns",container_type="normal",host="hostname",region="dev"} 616667
# HELP huatuo_bamai_netstat_container_TcpExt_TCPHPHits statistic TcpExtTCPHPHits.
# TYPE huatuo_bamai_netstat_container_TcpExt_TCPHPHits gauge
huatuo_bamai_netstat_container_TcpExt_TCPHPHits{container_host="coredns-855c4dd65d-8v5kg",container_hostnamespace="kube-system",container_level="burstable",container_name="coredns",container_type="normal",host="hostname",region="dev"} 9913
# HELP huatuo_bamai_netstat_container_TcpExt_TCPHystartDelayCwnd statistic TcpExtTCPHystartDelayCwnd.
# TYPE huatuo_bamai_netstat_container_TcpExt_TCPHystartDelayCwnd gauge
huatuo_bamai_netstat_container_TcpExt_TCPHystartDelayCwnd{container_host="coredns-855c4dd65d-8v5kg",container_hostnamespace="kube-system",container_level="burstable",container_name="coredns",container_type="normal",host="hostname",region="dev"} 0
# HELP huatuo_bamai_netstat_container_TcpExt_TCPHystartDelayDetect statistic TcpExtTCPHystartDelayDetect.
# TYPE huatuo_bamai_netstat_container_TcpExt_TCPHystartDelayDetect gauge
huatuo_bamai_netstat_container_TcpExt_TCPHystartDelayDetect{container_host="coredns-855c4dd65d-8v5kg",container_hostnamespace="kube-system",container_level="burstable",container_name="coredns",container_type="normal",host="hostname",region="dev"} 0
# HELP huatuo_bamai_netstat_container_TcpExt_TCPHystartTrainCwnd statistic TcpExtTCPHystartTrainCwnd.
# TYPE huatuo_bamai_netstat_container_TcpExt_TCPHystartTrainCwnd gauge
huatuo_bamai_netstat_container_TcpExt_TCPHystartTrainCwnd{container_host="coredns-855c4dd65d-8v5kg",container_hostnamespace="kube-system",container_level="burstable",container_name="coredns",container_type="normal",host="hostname",region="dev"} 0
# HELP huatuo_bamai_netstat_container_TcpExt_TCPHystartTrainDetect statistic TcpExtTCPHystartTrainDetect.
# TYPE huatuo_bamai_netstat_container_TcpExt_TCPHystartTrainDetect gauge
huatuo_bamai_netstat_container_TcpExt_TCPHystartTrainDetect{container_host="coredns-855c4dd65d-8v5kg",container_hostnamespace="kube-system",container_level="burstable",container_name="coredns",container_type="normal",host="hostname",region="dev"} 0
# HELP huatuo_bamai_netstat_container_TcpExt_TCPKeepAlive statistic TcpExtTCPKeepAlive.
# TYPE huatuo_bamai_netstat_container_TcpExt_TCPKeepAlive gauge
huatuo_bamai_netstat_container_TcpExt_TCPKeepAlive{container_host="coredns-855c4dd65d-8v5kg",container_hostnamespace="kube-system",container_level="burstable",container_name="coredns",container_type="normal",host="hostname",region="dev"} 20
# HELP huatuo_bamai_netstat_container_TcpExt_TCPLossFailures statistic TcpExtTCPLossFailures.
# TYPE huatuo_bamai_netstat_container_TcpExt_TCPLossFailures gauge
huatuo_bamai_netstat_container_TcpExt_TCPLossFailures{container_host="coredns-855c4dd65d-8v5kg",container_hostnamespace="kube-system",container_level="burstable",container_name="coredns",container_type="normal",host="hostname",region="dev"} 0
# HELP huatuo_bamai_netstat_container_TcpExt_TCPLossProbeRecovery statistic TcpExtTCPLossProbeRecovery.
# TYPE huatuo_bamai_netstat_container_TcpExt_TCPLossProbeRecovery gauge
huatuo_bamai_netstat_container_TcpExt_TCPLossProbeRecovery{container_host="coredns-855c4dd65d-8v5kg",container_hostnamespace="kube-system",container_level="burstable",container_name="coredns",container_type="normal",host="hostname",region="dev"} 0
# HELP huatuo_bamai_netstat_container_TcpExt_TCPLossProbes statistic TcpExtTCPLossProbes.
# TYPE huatuo_bamai_netstat_container_TcpExt_TCPLossProbes gauge
huatuo_bamai_netstat_container_TcpExt_TCPLossProbes{container_host="coredns-855c4dd65d-8v5kg",container_hostnamespace="kube-system",container_level="burstable",container_name="coredns",container_type="normal",host="hostname",region="dev"} 1
# HELP huatuo_bamai_netstat_container_TcpExt_TCPLossUndo statistic TcpExtTCPLossUndo.
# TYPE huatuo_bamai_netstat_container_TcpExt_TCPLossUndo gauge
huatuo_bamai_netstat_container_TcpExt_TCPLossUndo{container_host="coredns-855c4dd65d-8v5kg",container_hostnamespace="kube-system",container_level="burstable",container_name="coredns",container_type="normal",host="hostname",region="dev"} 0
# HELP huatuo_bamai_netstat_container_TcpExt_TCPLostRetransmit statistic TcpExtTCPLostRetransmit.
# TYPE huatuo_bamai_netstat_container_TcpExt_TCPLostRetransmit gauge
huatuo_bamai_netstat_container_TcpExt_TCPLostRetransmit{container_host="coredns-855c4dd65d-8v5kg",container_hostnamespace="kube-system",container_level="burstable",container_name="coredns",container_type="normal",host="hostname",region="dev"} 0
# HELP huatuo_bamai_netstat_container_TcpExt_TCPMD5Failure statistic TcpExtTCPMD5Failure.
# TYPE huatuo_bamai_netstat_container_TcpExt_TCPMD5Failure gauge
huatuo_bamai_netstat_container_TcpExt_TCPMD5Failure{container_host="coredns-855c4dd65d-8v5kg",container_hostnamespace="kube-system",container_level="burstable",container_name="coredns",container_type="normal",host="hostname",region="dev"} 0
# HELP huatuo_bamai_netstat_container_TcpExt_TCPMD5NotFound statistic TcpExtTCPMD5NotFound.
# TYPE huatuo_bamai_netstat_container_TcpExt_TCPMD5NotFound gauge
huatuo_bamai_netstat_container_TcpExt_TCPMD5NotFound{container_host="coredns-855c4dd65d-8v5kg",container_hostnamespace="kube-system",container_level="burstable",container_name="coredns",container_type="normal",host="hostname",region="dev"} 0
# HELP huatuo_bamai_netstat_container_TcpExt_TCPMD5Unexpected statistic TcpExtTCPMD5Unexpected.
# TYPE huatuo_bamai_netstat_container_TcpExt_TCPMD5Unexpected gauge
huatuo_bamai_netstat_container_TcpExt_TCPMD5Unexpected{container_host="coredns-855c4dd65d-8v5kg",container_hostnamespace="kube-system",container_level="burstable",container_name="coredns",container_type="normal",host="hostname",region="dev"} 0
# HELP huatuo_bamai_netstat_container_TcpExt_TCPMTUPFail statistic TcpExtTCPMTUPFail.
# TYPE huatuo_bamai_netstat_container_TcpExt_TCPMTUPFail gauge
huatuo_bamai_netstat_container_TcpExt_TCPMTUPFail{container_host="coredns-855c4dd65d-8v5kg",container_hostnamespace="kube-system",container_level="burstable",container_name="coredns",container_type="normal",host="hostname",region="dev"} 0
# HELP huatuo_bamai_netstat_container_TcpExt_TCPMTUPSuccess statistic TcpExtTCPMTUPSuccess.
# TYPE huatuo_bamai_netstat_container_TcpExt_TCPMTUPSuccess gauge
huatuo_bamai_netstat_container_TcpExt_TCPMTUPSuccess{container_host="coredns-855c4dd65d-8v5kg",container_hostnamespace="kube-system",container_level="burstable",container_name="coredns",container_type="normal",host="hostname",region="dev"} 0
# HELP huatuo_bamai_netstat_container_TcpExt_TCPMemoryPressures statistic TcpExtTCPMemoryPressures.
# TYPE huatuo_bamai_netstat_container_TcpExt_TCPMemoryPressures gauge
huatuo_bamai_netstat_container_TcpExt_TCPMemoryPressures{container_host="coredns-855c4dd65d-8v5kg",container_hostnamespace="kube-system",container_level="burstable",container_name="coredns",container_type="normal",host="hostname",region="dev"} 0
# HELP huatuo_bamai_netstat_container_TcpExt_TCPMemoryPressuresChrono statistic TcpExtTCPMemoryPressuresChrono.
# TYPE huatuo_bamai_netstat_container_TcpExt_TCPMemoryPressuresChrono gauge
huatuo_bamai_netstat_container_TcpExt_TCPMemoryPressuresChrono{container_host="coredns-855c4dd65d-8v5kg",container_hostnamespace="kube-system",container_level="burstable",container_name="coredns",container_type="normal",host="hostname",region="dev"} 0
# HELP huatuo_bamai_netstat_container_TcpExt_TCPMigrateReqFailure statistic TcpExtTCPMigrateReqFailure.
# TYPE huatuo_bamai_netstat_container_TcpExt_TCPMigrateReqFailure gauge
huatuo_bamai_netstat_container_TcpExt_TCPMigrateReqFailure{container_host="coredns-855c4dd65d-8v5kg",container_hostnamespace="kube-system",container_level="burstable",container_name="coredns",container_type="normal",host="hostname",region="dev"} 0
# HELP huatuo_bamai_netstat_container_TcpExt_TCPMigrateReqSuccess statistic TcpExtTCPMigrateReqSuccess.
# TYPE huatuo_bamai_netstat_container_TcpExt_TCPMigrateReqSuccess gauge
huatuo_bamai_netstat_container_TcpExt_TCPMigrateReqSuccess{container_host="coredns-855c4dd65d-8v5kg",container_hostnamespace="kube-system",container_level="burstable",container_name="coredns",container_type="normal",host="hostname",region="dev"} 0
# HELP huatuo_bamai_netstat_container_TcpExt_TCPMinTTLDrop statistic TcpExtTCPMinTTLDrop.
# TYPE huatuo_bamai_netstat_container_TcpExt_TCPMinTTLDrop gauge
huatuo_bamai_netstat_container_TcpExt_TCPMinTTLDrop{container_host="coredns-855c4dd65d-8v5kg",container_hostnamespace="kube-system",container_level="burstable",container_name="coredns",container_type="normal",host="hostname",region="dev"} 0
# HELP huatuo_bamai_netstat_container_TcpExt_TCPOFODrop statistic TcpExtTCPOFODrop.
# TYPE huatuo_bamai_netstat_container_TcpExt_TCPOFODrop gauge
huatuo_bamai_netstat_container_TcpExt_TCPOFODrop{container_host="coredns-855c4dd65d-8v5kg",container_hostnamespace="kube-system",container_level="burstable",container_name="coredns",container_type="normal",host="hostname",region="dev"} 0
# HELP huatuo_bamai_netstat_container_TcpExt_TCPOFOMerge statistic TcpExtTCPOFOMerge.
# TYPE huatuo_bamai_netstat_container_TcpExt_TCPOFOMerge gauge
huatuo_bamai_netstat_container_TcpExt_TCPOFOMerge{container_host="coredns-855c4dd65d-8v5kg",container_hostnamespace="kube-system",container_level="burstable",container_name="coredns",container_type="normal",host="hostname",region="dev"} 0
# HELP huatuo_bamai_netstat_container_TcpExt_TCPOFOQueue statistic TcpExtTCPOFOQueue.
# TYPE huatuo_bamai_netstat_container_TcpExt_TCPOFOQueue gauge
huatuo_bamai_netstat_container_TcpExt_TCPOFOQueue{container_host="coredns-855c4dd65d-8v5kg",container_hostnamespace="kube-system",container_level="burstable",container_name="coredns",container_type="normal",host="hostname",region="dev"} 0
# HELP huatuo_bamai_netstat_container_TcpExt_TCPOrigDataSent statistic TcpExtTCPOrigDataSent.
# TYPE huatuo_bamai_netstat_container_TcpExt_TCPOrigDataSent gauge
huatuo_bamai_netstat_container_TcpExt_TCPOrigDataSent{container_host="coredns-855c4dd65d-8v5kg",container_hostnamespace="kube-system",container_level="burstable",container_name="coredns",container_type="normal",host="hostname",region="dev"} 2.675557e+06
# HELP huatuo_bamai_netstat_container_TcpExt_TCPPLBRehash statistic TcpExtTCPPLBRehash.
# TYPE huatuo_bamai_netstat_container_TcpExt_TCPPLBRehash gauge
huatuo_bamai_netstat_container_TcpExt_TCPPLBRehash{container_host="coredns-855c4dd65d-8v5kg",container_hostnamespace="kube-system",container_level="burstable",container_name="coredns",container_type="normal",host="hostname",region="dev"} 0
# HELP huatuo_bamai_netstat_container_TcpExt_TCPPartialUndo statistic TcpExtTCPPartialUndo.
# TYPE huatuo_bamai_netstat_container_TcpExt_TCPPartialUndo gauge
huatuo_bamai_netstat_container_TcpExt_TCPPartialUndo{container_host="coredns-855c4dd65d-8v5kg",container_hostnamespace="kube-system",container_level="burstable",container_name="coredns",container_type="normal",host="hostname",region="dev"} 0
# HELP huatuo_bamai_netstat_container_TcpExt_TCPPureAcks statistic TcpExtTCPPureAcks.
# TYPE huatuo_bamai_netstat_container_TcpExt_TCPPureAcks gauge
huatuo_bamai_netstat_container_TcpExt_TCPPureAcks{container_host="coredns-855c4dd65d-8v5kg",container_hostnamespace="kube-system",container_level="burstable",container_name="coredns",container_type="normal",host="hostname",region="dev"} 2.095262e+06
# HELP huatuo_bamai_netstat_container_TcpExt_TCPRcvCoalesce statistic TcpExtTCPRcvCoalesce.
# TYPE huatuo_bamai_netstat_container_TcpExt_TCPRcvCoalesce gauge
huatuo_bamai_netstat_container_TcpExt_TCPRcvCoalesce{container_host="coredns-855c4dd65d-8v5kg",container_hostnamespace="kube-system",container_level="burstable",container_name="coredns",container_type="normal",host="hostname",region="dev"} 3
# HELP huatuo_bamai_netstat_container_TcpExt_TCPRcvCollapsed statistic TcpExtTCPRcvCollapsed.
# TYPE huatuo_bamai_netstat_container_TcpExt_TCPRcvCollapsed gauge
huatuo_bamai_netstat_container_TcpExt_TCPRcvCollapsed{container_host="coredns-855c4dd65d-8v5kg",container_hostnamespace="kube-system",container_level="burstable",container_name="coredns",container_type="normal",host="hostname",region="dev"} 0
# HELP huatuo_bamai_netstat_container_TcpExt_TCPRcvQDrop statistic TcpExtTCPRcvQDrop.
# TYPE huatuo_bamai_netstat_container_TcpExt_TCPRcvQDrop gauge
huatuo_bamai_netstat_container_TcpExt_TCPRcvQDrop{container_host="coredns-855c4dd65d-8v5kg",container_hostnamespace="kube-system",container_level="burstable",container_name="coredns",container_type="normal",host="hostname",region="dev"} 0
# HELP huatuo_bamai_netstat_container_TcpExt_TCPRenoFailures statistic TcpExtTCPRenoFailures.
# TYPE huatuo_bamai_netstat_container_TcpExt_TCPRenoFailures gauge
huatuo_bamai_netstat_container_TcpExt_TCPRenoFailures{container_host="coredns-855c4dd65d-8v5kg",container_hostnamespace="kube-system",container_level="burstable",container_name="coredns",container_type="normal",host="hostname",region="dev"} 0
# HELP huatuo_bamai_netstat_container_TcpExt_TCPRenoRecovery statistic TcpExtTCPRenoRecovery.
# TYPE huatuo_bamai_netstat_container_TcpExt_TCPRenoRecovery gauge
huatuo_bamai_netstat_container_TcpExt_TCPRenoRecovery{container_host="coredns-855c4dd65d-8v5kg",container_hostnamespace="kube-system",container_level="burstable",container_name="coredns",container_type="normal",host="hostname",region="dev"} 0
# HELP huatuo_bamai_netstat_container_TcpExt_TCPRenoRecoveryFail statistic TcpExtTCPRenoRecoveryFail.
# TYPE huatuo_bamai_netstat_container_TcpExt_TCPRenoRecoveryFail gauge
huatuo_bamai_netstat_container_TcpExt_TCPRenoRecoveryFail{container_host="coredns-855c4dd65d-8v5kg",container_hostnamespace="kube-system",container_level="burstable",container_name="coredns",container_type="normal",host="hostname",region="dev"} 0
# HELP huatuo_bamai_netstat_container_TcpExt_TCPRenoReorder statistic TcpExtTCPRenoReorder.
# TYPE huatuo_bamai_netstat_container_TcpExt_TCPRenoReorder gauge
huatuo_bamai_netstat_container_TcpExt_TCPRenoReorder{container_host="coredns-855c4dd65d-8v5kg",container_hostnamespace="kube-system",container_level="burstable",container_name="coredns",container_type="normal",host="hostname",region="dev"} 0
# HELP huatuo_bamai_netstat_container_TcpExt_TCPReqQFullDoCookies statistic TcpExtTCPReqQFullDoCookies.
# TYPE huatuo_bamai_netstat_container_TcpExt_TCPReqQFullDoCookies gauge
huatuo_bamai_netstat_container_TcpExt_TCPReqQFullDoCookies{container_host="coredns-855c4dd65d-8v5kg",container_hostnamespace="kube-system",container_level="burstable",container_name="coredns",container_type="normal",host="hostname",region="dev"} 0
# HELP huatuo_bamai_netstat_container_TcpExt_TCPReqQFullDrop statistic TcpExtTCPReqQFullDrop.
# TYPE huatuo_bamai_netstat_container_TcpExt_TCPReqQFullDrop gauge
huatuo_bamai_netstat_container_TcpExt_TCPReqQFullDrop{container_host="coredns-855c4dd65d-8v5kg",container_hostnamespace="kube-system",container_level="burstable",container_name="coredns",container_type="normal",host="hostname",region="dev"} 0
# HELP huatuo_bamai_netstat_container_TcpExt_TCPRetransFail statistic TcpExtTCPRetransFail.
# TYPE huatuo_bamai_netstat_container_TcpExt_TCPRetransFail gauge
huatuo_bamai_netstat_container_TcpExt_TCPRetransFail{container_host="coredns-855c4dd65d-8v5kg",container_hostnamespace="kube-system",container_level="burstable",container_name="coredns",container_type="normal",host="hostname",region="dev"} 0
# HELP huatuo_bamai_netstat_container_TcpExt_TCPSACKDiscard statistic TcpExtTCPSACKDiscard.
# TYPE huatuo_bamai_netstat_container_TcpExt_TCPSACKDiscard gauge
huatuo_bamai_netstat_container_TcpExt_TCPSACKDiscard{container_host="coredns-855c4dd65d-8v5kg",container_hostnamespace="kube-system",container_level="burstable",container_name="coredns",container_type="normal",host="hostname",region="dev"} 0
# HELP huatuo_bamai_netstat_container_TcpExt_TCPSACKReneging statistic TcpExtTCPSACKReneging.
# TYPE huatuo_bamai_netstat_container_TcpExt_TCPSACKReneging gauge
huatuo_bamai_netstat_container_TcpExt_TCPSACKReneging{container_host="coredns-855c4dd65d-8v5kg",container_hostnamespace="kube-system",container_level="burstable",container_name="coredns",container_type="normal",host="hostname",region="dev"} 0
# HELP huatuo_bamai_netstat_container_TcpExt_TCPSACKReorder statistic TcpExtTCPSACKReorder.
# TYPE huatuo_bamai_netstat_container_TcpExt_TCPSACKReorder gauge
huatuo_bamai_netstat_container_TcpExt_TCPSACKReorder{container_host="coredns-855c4dd65d-8v5kg",container_hostnamespace="kube-system",container_level="burstable",container_name="coredns",container_type="normal",host="hostname",region="dev"} 0
# HELP huatuo_bamai_netstat_container_TcpExt_TCPSYNChallenge statistic TcpExtTCPSYNChallenge.
# TYPE huatuo_bamai_netstat_container_TcpExt_TCPSYNChallenge gauge
huatuo_bamai_netstat_container_TcpExt_TCPSYNChallenge{container_host="coredns-855c4dd65d-8v5kg",container_hostnamespace="kube-system",container_level="burstable",container_name="coredns",container_type="normal",host="hostname",region="dev"} 0
# HELP huatuo_bamai_netstat_container_TcpExt_TCPSackFailures statistic TcpExtTCPSackFailures.
# TYPE huatuo_bamai_netstat_container_TcpExt_TCPSackFailures gauge
huatuo_bamai_netstat_container_TcpExt_TCPSackFailures{container_host="coredns-855c4dd65d-8v5kg",container_hostnamespace="kube-system",container_level="burstable",container_name="coredns",container_type="normal",host="hostname",region="dev"} 0
# HELP huatuo_bamai_netstat_container_TcpExt_TCPSackMerged statistic TcpExtTCPSackMerged.
# TYPE huatuo_bamai_netstat_container_TcpExt_TCPSackMerged gauge
huatuo_bamai_netstat_container_TcpExt_TCPSackMerged{container_host="coredns-855c4dd65d-8v5kg",container_hostnamespace="kube-system",container_level="burstable",container_name="coredns",container_type="normal",host="hostname",region="dev"} 0
# HELP huatuo_bamai_netstat_container_TcpExt_TCPSackRecovery statistic TcpExtTCPSackRecovery.
# TYPE huatuo_bamai_netstat_container_TcpExt_TCPSackRecovery gauge
huatuo_bamai_netstat_container_TcpExt_TCPSackRecovery{container_host="coredns-855c4dd65d-8v5kg",container_hostnamespace="kube-system",container_level="burstable",container_name="coredns",container_type="normal",host="hostname",region="dev"} 0
# HELP huatuo_bamai_netstat_container_TcpExt_TCPSackRecoveryFail statistic TcpExtTCPSackRecoveryFail.
# TYPE huatuo_bamai_netstat_container_TcpExt_TCPSackRecoveryFail gauge
huatuo_bamai_netstat_container_TcpExt_TCPSackRecoveryFail{container_host="coredns-855c4dd65d-8v5kg",container_hostnamespace="kube-system",container_level="burstable",container_name="coredns",container_type="normal",host="hostname",region="dev"} 0
# HELP huatuo_bamai_netstat_container_TcpExt_TCPSackShiftFallback statistic TcpExtTCPSackShiftFallback.
# TYPE huatuo_bamai_netstat_container_TcpExt_TCPSackShiftFallback gauge
huatuo_bamai_netstat_container_TcpExt_TCPSackShiftFallback{container_host="coredns-855c4dd65d-8v5kg",container_hostnamespace="kube-system",container_level="burstable",container_name="coredns",container_type="normal",host="hostname",region="dev"} 0
# HELP huatuo_bamai_netstat_container_TcpExt_TCPSackShifted statistic TcpExtTCPSackShifted.
# TYPE huatuo_bamai_netstat_container_TcpExt_TCPSackShifted gauge
huatuo_bamai_netstat_container_TcpExt_TCPSackShifted{container_host="coredns-855c4dd65d-8v5kg",container_hostnamespace="kube-system",container_level="burstable",container_name="coredns",container_type="normal",host="hostname",region="dev"} 0
# HELP huatuo_bamai_netstat_container_TcpExt_TCPSlowStartRetrans statistic TcpExtTCPSlowStartRetrans.
# TYPE huatuo_bamai_netstat_container_TcpExt_TCPSlowStartRetrans gauge
huatuo_bamai_netstat_container_TcpExt_TCPSlowStartRetrans{container_host="coredns-855c4dd65d-8v5kg",container_hostnamespace="kube-system",container_level="burstable",container_name="coredns",container_type="normal",host="hostname",region="dev"} 0
# HELP huatuo_bamai_netstat_container_TcpExt_TCPSpuriousRTOs statistic TcpExtTCPSpuriousRTOs.
# TYPE huatuo_bamai_netstat_container_TcpExt_TCPSpuriousRTOs gauge
huatuo_bamai_netstat_container_TcpExt_TCPSpuriousRTOs{container_host="coredns-855c4dd65d-8v5kg",container_hostnamespace="kube-system",container_level="burstable",container_name="coredns",container_type="normal",host="hostname",region="dev"} 0
# HELP huatuo_bamai_netstat_container_TcpExt_TCPSpuriousRtxHostQueues statistic TcpExtTCPSpuriousRtxHostQueues.
# TYPE huatuo_bamai_netstat_container_TcpExt_TCPSpuriousRtxHostQueues gauge
huatuo_bamai_netstat_container_TcpExt_TCPSpuriousRtxHostQueues{container_host="coredns-855c4dd65d-8v5kg",container_hostnamespace="kube-system",container_level="burstable",container_name="coredns",container_type="normal",host="hostname",region="dev"} 0
# HELP huatuo_bamai_netstat_container_TcpExt_TCPSynRetrans statistic TcpExtTCPSynRetrans.
# TYPE huatuo_bamai_netstat_container_TcpExt_TCPSynRetrans gauge
huatuo_bamai_netstat_container_TcpExt_TCPSynRetrans{container_host="coredns-855c4dd65d-8v5kg",container_hostnamespace="kube-system",container_level="burstable",container_name="coredns",container_type="normal",host="hostname",region="dev"} 0
# HELP huatuo_bamai_netstat_container_TcpExt_TCPTSReorder statistic TcpExtTCPTSReorder.
# TYPE huatuo_bamai_netstat_container_TcpExt_TCPTSReorder gauge
huatuo_bamai_netstat_container_TcpExt_TCPTSReorder{container_host="coredns-855c4dd65d-8v5kg",container_hostnamespace="kube-system",container_level="burstable",container_name="coredns",container_type="normal",host="hostname",region="dev"} 0
# HELP huatuo_bamai_netstat_container_TcpExt_TCPTimeWaitOverflow statistic TcpExtTCPTimeWaitOverflow.
# TYPE huatuo_bamai_netstat_container_TcpExt_TCPTimeWaitOverflow gauge
huatuo_bamai_netstat_container_TcpExt_TCPTimeWaitOverflow{container_host="coredns-855c4dd65d-8v5kg",container_hostnamespace="kube-system",container_level="burstable",container_name="coredns",container_type="normal",host="hostname",region="dev"} 0
# HELP huatuo_bamai_netstat_container_TcpExt_TCPTimeouts statistic TcpExtTCPTimeouts.
# TYPE huatuo_bamai_netstat_container_TcpExt_TCPTimeouts gauge
huatuo_bamai_netstat_container_TcpExt_TCPTimeouts{container_host="coredns-855c4dd65d-8v5kg",container_hostnamespace="kube-system",container_level="burstable",container_name="coredns",container_type="normal",host="hostname",region="dev"} 0
# HELP huatuo_bamai_netstat_container_TcpExt_TCPToZeroWindowAdv statistic TcpExtTCPToZeroWindowAdv.
# TYPE huatuo_bamai_netstat_container_TcpExt_TCPToZeroWindowAdv gauge
huatuo_bamai_netstat_container_TcpExt_TCPToZeroWindowAdv{container_host="coredns-855c4dd65d-8v5kg",container_hostnamespace="kube-system",container_level="burstable",container_name="coredns",container_type="normal",host="hostname",region="dev"} 0
# HELP huatuo_bamai_netstat_container_TcpExt_TCPWantZeroWindowAdv statistic TcpExtTCPWantZeroWindowAdv.
# TYPE huatuo_bamai_netstat_container_TcpExt_TCPWantZeroWindowAdv gauge
huatuo_bamai_netstat_container_TcpExt_TCPWantZeroWindowAdv{container_host="coredns-855c4dd65d-8v5kg",container_hostnamespace="kube-system",container_level="burstable",container_name="coredns",container_type="normal",host="hostname",region="dev"} 0
# HELP huatuo_bamai_netstat_container_TcpExt_TCPWinProbe statistic TcpExtTCPWinProbe.
# TYPE huatuo_bamai_netstat_container_TcpExt_TCPWinProbe gauge
huatuo_bamai_netstat_container_TcpExt_TCPWinProbe{container_host="coredns-855c4dd65d-8v5kg",container_hostnamespace="kube-system",container_level="burstable",container_name="coredns",container_type="normal",host="hostname",region="dev"} 0
# HELP huatuo_bamai_netstat_container_TcpExt_TCPWqueueTooBig statistic TcpExtTCPWqueueTooBig.
# TYPE huatuo_bamai_netstat_container_TcpExt_TCPWqueueTooBig gauge
huatuo_bamai_netstat_container_TcpExt_TCPWqueueTooBig{container_host="coredns-855c4dd65d-8v5kg",container_hostnamespace="kube-system",container_level="burstable",container_name="coredns",container_type="normal",host="hostname",region="dev"} 0
# HELP huatuo_bamai_netstat_container_TcpExt_TCPZeroWindowDrop statistic TcpExtTCPZeroWindowDrop.
# TYPE huatuo_bamai_netstat_container_TcpExt_TCPZeroWindowDrop gauge
huatuo_bamai_netstat_container_TcpExt_TCPZeroWindowDrop{container_host="coredns-855c4dd65d-8v5kg",container_hostnamespace="kube-system",container_level="burstable",container_name="coredns",container_type="normal",host="hostname",region="dev"} 0
# HELP huatuo_bamai_netstat_container_TcpExt_TW statistic TcpExtTW.
# TYPE huatuo_bamai_netstat_container_TcpExt_TW gauge
huatuo_bamai_netstat_container_TcpExt_TW{container_host="coredns-855c4dd65d-8v5kg",container_hostnamespace="kube-system",container_level="burstable",container_name="coredns",container_type="normal",host="hostname",region="dev"} 720624
# HELP huatuo_bamai_netstat_container_TcpExt_TWKilled statistic TcpExtTWKilled.
# TYPE huatuo_bamai_netstat_container_TcpExt_TWKilled gauge
huatuo_bamai_netstat_container_TcpExt_TWKilled{container_host="coredns-855c4dd65d-8v5kg",container_hostnamespace="kube-system",container_level="burstable",container_name="coredns",container_type="normal",host="hostname",region="dev"} 0
# HELP huatuo_bamai_netstat_container_TcpExt_TWRecycled statistic TcpExtTWRecycled.
# TYPE huatuo_bamai_netstat_container_TcpExt_TWRecycled gauge
huatuo_bamai_netstat_container_TcpExt_TWRecycled{container_host="coredns-855c4dd65d-8v5kg",container_hostnamespace="kube-system",container_level="burstable",container_name="coredns",container_type="normal",host="hostname",region="dev"} 2461
# HELP huatuo_bamai_netstat_container_TcpExt_TcpDuplicateDataRehash statistic TcpExtTcpDuplicateDataRehash.
# TYPE huatuo_bamai_netstat_container_TcpExt_TcpDuplicateDataRehash gauge
huatuo_bamai_netstat_container_TcpExt_TcpDuplicateDataRehash{container_host="coredns-855c4dd65d-8v5kg",container_hostnamespace="kube-system",container_level="burstable",container_name="coredns",container_type="normal",host="hostname",region="dev"} 0
# HELP huatuo_bamai_netstat_container_TcpExt_TcpTimeoutRehash statistic TcpExtTcpTimeoutRehash.
# TYPE huatuo_bamai_netstat_container_TcpExt_TcpTimeoutRehash gauge
huatuo_bamai_netstat_container_TcpExt_TcpTimeoutRehash{container_host="coredns-855c4dd65d-8v5kg",container_hostnamespace="kube-system",container_level="burstable",container_name="coredns",container_type="normal",host="hostname",region="dev"} 0
Ref:
Socket
# HELP huatuo_bamai_sockstat_container_FRAG_inuse Number of FRAG sockets in state inuse.
# TYPE huatuo_bamai_sockstat_container_FRAG_inuse gauge
huatuo_bamai_sockstat_container_FRAG_inuse{container_host="coredns-855c4dd65d-8v5kg",container_hostnamespace="kube-system",container_level="burstable",container_name="coredns",container_type="normal",host="hostname",region="dev"} 0
# HELP huatuo_bamai_sockstat_container_FRAG_memory Number of FRAG sockets in state memory.
# TYPE huatuo_bamai_sockstat_container_FRAG_memory gauge
huatuo_bamai_sockstat_container_FRAG_memory{container_host="coredns-855c4dd65d-8v5kg",container_hostnamespace="kube-system",container_level="burstable",container_name="coredns",container_type="normal",host="hostname",region="dev"} 0
# HELP huatuo_bamai_sockstat_container_RAW_inuse Number of RAW sockets in state inuse.
# TYPE huatuo_bamai_sockstat_container_RAW_inuse gauge
huatuo_bamai_sockstat_container_RAW_inuse{container_host="coredns-855c4dd65d-8v5kg",container_hostnamespace="kube-system",container_level="burstable",container_name="coredns",container_type="normal",host="hostname",region="dev"} 0
# HELP huatuo_bamai_sockstat_container_TCP_alloc Number of TCP sockets in state alloc.
# TYPE huatuo_bamai_sockstat_container_TCP_alloc gauge
huatuo_bamai_sockstat_container_TCP_alloc{container_host="coredns-855c4dd65d-8v5kg",container_hostnamespace="kube-system",container_level="burstable",container_name="coredns",container_type="normal",host="hostname",region="dev"} 171
# HELP huatuo_bamai_sockstat_container_TCP_inuse Number of TCP sockets in state inuse.
# TYPE huatuo_bamai_sockstat_container_TCP_inuse gauge
huatuo_bamai_sockstat_container_TCP_inuse{container_host="coredns-855c4dd65d-8v5kg",container_hostnamespace="kube-system",container_level="burstable",container_name="coredns",container_type="normal",host="hostname",region="dev"} 1
# HELP huatuo_bamai_sockstat_container_TCP_orphan Number of TCP sockets in state orphan.
# TYPE huatuo_bamai_sockstat_container_TCP_orphan gauge
huatuo_bamai_sockstat_container_TCP_orphan{container_host="coredns-855c4dd65d-8v5kg",container_hostnamespace="kube-system",container_level="burstable",container_name="coredns",container_type="normal",host="hostname",region="dev"} 0
# HELP huatuo_bamai_sockstat_container_TCP_tw Number of TCP sockets in state tw.
# TYPE huatuo_bamai_sockstat_container_TCP_tw gauge
huatuo_bamai_sockstat_container_TCP_tw{container_host="coredns-855c4dd65d-8v5kg",container_hostnamespace="kube-system",container_level="burstable",container_name="coredns",container_type="normal",host="hostname",region="dev"} 75
# HELP huatuo_bamai_sockstat_container_UDPLITE_inuse Number of UDPLITE sockets in state inuse.
# TYPE huatuo_bamai_sockstat_container_UDPLITE_inuse gauge
huatuo_bamai_sockstat_container_UDPLITE_inuse{container_host="coredns-855c4dd65d-8v5kg",container_hostnamespace="kube-system",container_level="burstable",container_name="coredns",container_type="normal",host="hostname",region="dev"} 0
# HELP huatuo_bamai_sockstat_container_UDP_inuse Number of UDP sockets in state inuse.
# TYPE huatuo_bamai_sockstat_container_UDP_inuse gauge
huatuo_bamai_sockstat_container_UDP_inuse{container_host="coredns-855c4dd65d-8v5kg",container_hostnamespace="kube-system",container_level="burstable",container_name="coredns",container_type="normal",host="hostname",region="dev"} 0
# HELP huatuo_bamai_sockstat_container_sockets_used Number of IPv4 sockets in use.
# TYPE huatuo_bamai_sockstat_container_sockets_used gauge
huatuo_bamai_sockstat_container_sockets_used{container_host="coredns-855c4dd65d-8v5kg",container_hostnamespace="kube-system",container_level="burstable",container_name="coredns",container_type="normal",host="hostname",region="dev"} 7
# HELP huatuo_bamai_sockstat_sockets_used Number of IPv4 sockets in use.
# TYPE huatuo_bamai_sockstat_sockets_used gauge
huatuo_bamai_sockstat_sockets_used{host="hostname",region="dev"} 409
| Metric | Description | Unit | Scope | Labels |
|---|---|---|---|---|
| sockstat_sockets_used | Total number of sockets currently in use on the system | count | Host | |
| sockstat_TCP_inuse | Number of TCP sockets in active connection states | count | Host, Container | |
| sockstat_TCP_orphan | Number of TCP sockets without an owning process | count | Host, Container | |
| sockstat_TCP_tw | Number of TCP sockets currently in TIME_WAIT state | count | Host, Container | |
| sockstat_TCP_alloc | Total number of allocated TCP socket objects | count | Host, Container | |
| sockstat_TCP_mem | Number of memory pages currently used by TCP sockets | count | Host |
IO
Queue
Hardware
General System
Soft Lockup
# HELP huatuo_bamai_softlockup_total softlockup counter
# TYPE huatuo_bamai_softlockup_total counter
huatuo_bamai_softlockup_total{host="hostname",region="dev"} 0
| Metric | Description | Unit | Target | Source | Labels |
|---|---|---|---|---|---|
| softlockup_total | Count of soft lockup events | count | Host | BPF |
HungTask
# HELP huatuo_bamai_hungtask_total hungtask counter
# TYPE huatuo_bamai_hungtask_total counter
huatuo_bamai_hungtask_total{host="hostname",region="dev"} 0
| Metric | Description | Unit | Target | Source | Labels |
|---|---|---|---|---|---|
| hungtask_total | Count of hung task events | count | Host | BPF |
GPU
- MetaX
| Metric | Description | Unit | Target | Source |
|---|---|---|---|---|
| metax_gpu_sdk_info | GPU SDK info. | - | version | sml.GetSDKVersion |
| metax_gpu_driver_info | GPU driver info. | - | version | sml.GetGPUVersion with driver unit |
| metax_gpu_info | GPU info. | - | gpu, model, uuid, bios_version, bdf, mode, die_count | sml.GetGPUInfo |
| metax_gpu_board_power_watts | GPU board power. | W | gpu | sml.ListGPUBoardWayElectricInfos |
| metax_gpu_pcie_link_speed_gt_per_second | GPU PCIe current link speed. | GT/s | gpu | sml.GetGPUPcieLinkInfo |
| metax_gpu_pcie_link_width_lanes | GPU PCIe current link width. | lanes | gpu | sml.GetGPUPcieLinkInfo |
| metax_gpu_pcie_receive_bytes_per_second | GPU PCIe receive throughput. | B/s | gpu | sml.GetGPUPcieThroughputInfo |
| metax_gpu_pcie_transmit_bytes_per_second | GPU PCIe transmit throughput. | B/s | gpu | sml.GetGPUPcieThroughputInfo |
| metax_gpu_metaxlink_link_speed_gt_per_second | GPU MetaXLink current link speed. | GT/s | gpu, metaxlink | sml.ListGPUMetaXLinkLinkInfos |
| metax_gpu_metaxlink_link_width_lanes | GPU MetaXLink current link width. | lanes | gpu, metaxlink | sml.ListGPUMetaXLinkLinkInfos |
| metax_gpu_metaxlink_receive_bytes_per_second | GPU MetaXLink receive throughput. | B/s | gpu, metaxlink | sml.ListGPUMetaXLinkThroughputInfos |
| metax_gpu_metaxlink_transmit_bytes_per_second | GPU MetaXLink transmit throughput. | B/s | gpu, metaxlink | sml.ListGPUMetaXLinkThroughputInfos |
| metax_gpu_metaxlink_receive_bytes_total | GPU MetaXLink receive data size. | bytes | gpu, metaxlink | sml.ListGPUMetaXLinkTrafficStatInfos |
| metax_gpu_metaxlink_transmit_bytes_total | GPU MetaXLink transmit data size. | bytes | gpu, metaxlink | sml.ListGPUMetaXLinkTrafficStatInfos |
| metax_gpu_metaxlink_aer_errors_total | GPU MetaXLink AER errors count. | count | gpu, metaxlink, error_type | sml.ListGPUMetaXLinkAerErrorsInfos |
| metax_gpu_status | GPU status, 0 means normal, other values means abnormal. Check the documentation to see the exceptions corresponding to each value. | - | gpu, die | sml.GetDieStatus |
| metax_gpu_temperature_celsius | GPU temperature. | °C | gpu, die | sml.GetDieTemperature |
| metax_gpu_utilization_percent | GPU utilization, ranging from 0 to 100. | % | gpu, die, ip | sml.GetDieUtilization |
| metax_gpu_memory_total_bytes | Total vram. | bytes | gpu, die | sml.GetDieMemoryInfo |
| metax_gpu_memory_used_bytes | Used vram. | bytes | gpu, die | sml.GetDieMemoryInfo |
| metax_gpu_clock_mhz | GPU clock. | MHz | gpu, die, ip | sml.ListDieClocks |
| metax_gpu_clocks_throttling | Reason(s) for GPU clocks throttling. | - | gpu, die, reason | sml.GetDieClocksThrottleStatus |
| metax_gpu_dpm_performance_level | GPU DPM performance level. | - | gpu, die, ip | sml.GetDieDPMPerformanceLevel |
| metax_gpu_ecc_memory_errors_total | GPU ECC memory errors count. | count | gpu, die, memory_type, error_type | sml.GetDieECCMemoryInfo |
| metax_gpu_ecc_memory_retired_pages_total | GPU ECC memory retired pages count. | count | gpu, die | sml.GetDieECCMemoryInfo |
6.2 - Events
The HUATUO platform uses eBPF technology to detect various abnormal events in the Linux kernel in real time, helping users quickly locate issues related to the system, applications, and hardware.
Supported Events
| Event Name | Core Function | Typical Scenarios |
|---|---|---|
| softirq | Detects excessively long softirq disable time in the kernel, outputs call stack and process information | Resolves system stalls, network latency, and scheduling delays |
| softlockup | Detects softlockup events and provides target process and kernel stack information | Locates and resolves system softlockup issues |
| hungtask | Detects hungtask events, outputs all D-state processes and their stack information | Captures transient mass D-state process scenarios and preserves fault scenes |
| oom | Detects OOM events in the host or containers | Focuses on memory exhaustion issues and provides detailed fault snapshots |
| memory_reclaim_events | Detects direct memory reclaim events, records reclaim duration, process and container information | Resolves business stalls caused by memory pressure |
| ras | Detects hardware faults in CPU, Memory, PCIe, etc. | Timely awareness of hardware failures to reduce business impact |
| dropwatch | Detects packet drops in the kernel network protocol stack, outputs call stack and network context | Resolves business jitters and latency caused by protocol stack packet drops |
| net_rx_latency | Detects latency events in the protocol stack receive path (driver → protocol → user space) | Resolves business timeouts and jitters caused by receive latency |
| netdev_events | Detects network device link status changes | Detects physical link failures on network cards |
| netdev_bonding_lacp | Detects bonding LACP protocol status changes | Identifies fault boundaries between physical machines and switches |
| netdev_txqueue_timeout | Detects network card transmit queue timeout events | Locates hardware failures in network card transmit queues |
Event Details
Common Fields
- hostname: Physical machine hostname
- region: Availability zone where the physical machine is located
- uploaded_time: Data upload time
- container_id: Container ID if the event is associated with a container
- container_hostname: Container hostname if the event is associated with a container
- container_host_namespace: Kubernetes namespace of the container if the event is associated with a container
- container_type: Container type, e.g.,
normalfor regular containers,sidecarfor sidecar containers, etc. - container_qos: Container QoS level
- tracer_name: Event name
- tracer_id: Tracing ID for this event
- tracer_time: Time when tracing was triggered
- tracer_type: Trigger type — manual or automatic
- tracer_data: Tracer-specific private data
1. softirq
Description
Detects when the kernel disables interrupts for too long. Records the kernel call stack during the disable period, current process information, and other key data to help analyze interrupt-related latency issues.
Data Storage
Event data is automatically stored in Elasticsearch or as files on the physical machine disk.
Sample Data
{
	"uploaded_time": "2025-06-11T16:05:16.251152703+08:00",
	"hostname": "***",
	"tracer_data": {
		"comm": "***-agent",
		"stack": "scheduler_tick/...",
		"now": 5532940660025295,
		"offtime": 237328905,
		"cpu": 1,
		"threshold": 100000000,
		"pid": 688073
	},
	"tracer_time": "2025-06-11 16:05:16.251 +0800",
	"tracer_type": "auto",
	"time": "2025-06-11 16:05:16.251 +0800",
	"region": "***",
	"tracer_name": "softirq"
}
Fields
- comm: Name of the process that triggered the event
- pid: Process ID that triggered the event
- saddr / daddr: Source IP / Destination IP
- sport / dport: Source port / Destination port
- seq / ack_seq: TCP sequence number / Acknowledgment sequence number
- state: TCP connection state (e.g., ESTABLISHED)
- pkt_len: Packet length (bytes)
- where: Location where the latency occurred (e.g., TO_USER_COPY indicates user-space copy stage)
- latency_ms: Actual latency (milliseconds)
2. dropwatch
Description Detects packet drop behavior in the kernel network protocol stack. Outputs the call stack and network address information at the time of the drop to help troubleshoot business anomalies caused by network packet loss.
Data Storage Automatically stored in Elasticsearch or as files on the physical machine disk.
Sample Data
"tracer_data": {
	"comm": "kubelet",
	"stack": "kfree_skb/...",
	"saddr": "10.79.68.62",
	"pid": 1687046,
	"type": "common_drop",
	"queue_mapping": ...
}
Fields
- comm: Name of the process that triggered the packet drop
- stack: Kernel call stack at the time of the drop
- saddr: Source IP address
- pid: Process ID
- type: Drop type (e.g., common_drop)
- queue_mapping: Network card queue mapping information (specific values depend on the actual drop scenario)
3. net_rx_latency
Description Detects latency events in the protocol stack receive path (network card driver → kernel protocol stack → user-space active receive). Triggers when the overall latency of a single packet from the network card to user-space reception exceeds the threshold (default 90 seconds). Records detailed network context information (such as 5-tuple, TCP sequence number, latency location, etc.) to help diagnose business timeouts and jitters caused by protocol stack or application receive delays.
Typical Scenarios Resolves network performance issues caused by protocol stack receive latency or slow application response.
Data Storage Automatically stored in Elasticsearch or as files on the physical machine disk.
Sample Data
"tracer_data": {
	"comm": "nginx",
	"pid": 2921092,
	"saddr": "10.156.248.76",
	"daddr": "10.134.72.4",
	"sport": 9213,
	"dport": 49000,
	"seq": 1009085774,
	"ack_seq": 689410995,
	"state": "ESTABLISHED",
	"pkt_len": 26064,
	"where": "TO_USER_COPY",
	"latency_ms": 95973
}
Fields
- comm: Name of the process that triggered the event
- pid: Process ID that triggered the event
- saddr / daddr: Source IP / Destination IP
- sport / dport: Source port / Destination port
- seq / ack_seq: TCP sequence number / Acknowledgment sequence number
- state: TCP connection state (e.g., ESTABLISHED)
- pkt_len: Packet length (bytes)
- where: Location where the latency occurred (e.g., TO_USER_COPY indicates user-space copy stage)
- latency_ms: Actual latency (milliseconds)
4. oom
Description Detects OOM (Out of Memory) events occurring on the host or inside containers. Records information about the process killed by the OOM Killer (victim) and the process that triggered the OOM (trigger), along with corresponding container and memory cgroup details, providing a complete fault snapshot.
Typical Scenarios Focuses on memory exhaustion issues on physical machines or containers to quickly locate business failures caused by unavailable memory.
Data Storage Automatically stored in Elasticsearch or as files on the physical machine disk.
Sample Data
"tracer_data": {
	"victim_process_name": "java",
	"victim_pid": 3218745,
	"victim_container_hostname": "***.docker",
	"victim_container_id": "***",
	"victim_memcg_css": "0xff4b8d8be3818000",
	"trigger_process_name": "java",
	"trigger_pid": 3218804,
	"trigger_container_hostname": "***.docker",
	"trigger_container_id": "***",
	"trigger_memcg_css": "0xff4b8d8be3818000"
}
Fields
- victim_process_name / victim_pid: Name and PID of the process killed by the OOM Killer
- victim_container_hostname / victim_container_id: Hostname and container ID where the killed process resides
- victim_memcg_css: Memory cgroup pointer (hex) of the killed process
- trigger_process_name / trigger_pid: Name and PID of the process that triggered OOM
- trigger_container_hostname / trigger_container_id: Hostname and container ID where the triggering process resides
- trigger_memcg_css: Memory cgroup pointer (hex) of the triggering process
5. softlockup
Description Detects softlockup events (CPU unable to schedule for a long time, default threshold approximately 1 second). Provides information about the target process causing the lockup, the CPU where it occurred, the kernel call stack of that CPU, and records the number of occurrences.
Typical Scenarios Resolves system freezes or response anomalies caused by softlockup.
Data Storage Automatically stored in Elasticsearch or as files on the physical machine disk.
6. hungtask
Description Detects hungtask events, captures kernel stacks of all processes in D state (uninterruptible sleep), and records the total number of D-state processes and backtrace information for each CPU to preserve the fault scene.
Typical Scenarios Locates transient scenarios where a large number of D-state processes appear, facilitating subsequent problem tracking and analysis.
Data Storage Automatically stored in Elasticsearch or as files on the physical machine disk.
Sample Data
"tracer_data": {
	"cpus_stack": "2025-06-10 09:57:14 sysrq: Show backtrace of all active CPUs\nNMI backtrace for cpu 33\n...",
	"pid": 2567042,
	"d_process_count": "...",
	"blocked_processes_stack": "..."
}
Fields
- cpus_stack: NMI backtrace information for all CPUs (multi-line text containing timestamps and stack content)
- pid: PID of the process that triggered the hungtask detection
- d_process_count: Total number of D-state processes in the current system
- blocked_processes_stack: Kernel stack information of D-state processes
7. memory_reclaim_events
Description Detects direct memory reclaim events. Triggers when the direct reclaim time of the same process exceeds the threshold (default approximately 900 ms) within 1 second. Records the reclaim duration, process, and container information.
Typical Scenarios Resolves business process stalls caused by excessive system memory pressure.
Data Storage Automatically stored in Elasticsearch or as files on the physical machine disk.
Sample Data
"tracer_data": {
	"comm": "chrome",
	"pid": 1896137,
	"deltatime": 1412702917
}
Fields
- comm: Name of the process that triggered memory reclaim
- pid: PID of the process that triggered reclaim
- deltatime: Direct reclaim duration (nanoseconds)
8. netdev_events
Description Detects network card link status change events (including down/up, MTU changes, AdminDown, CarrierDown, etc.). Outputs interface name, status description, MAC address, and other information.
Typical Scenarios Timely detection of physical link issues on network cards to resolve business unavailability caused by network card failures.
Data Storage Automatically stored in Elasticsearch or as files on the physical machine disk.
Sample Data
"tracer_data": {
	"ifname": "eth1",
	"linkstatus": "linkStatusAdminDown, linkStatusCarrierDown",
	"mac": "5c:6f:69:34:dc:72",
	"index": 3,
	"start": false
}
Fields
- ifname: Network interface name (e.g., eth1)
- linkstatus: Detailed link status description
- mac: Network card MAC address
- index: Interface index
- start: Whether the interface is in start state (true/false)
9. netdev_bonding_lacp
Description Detects status changes of the LACP (Link Aggregation Control Protocol) in bonding mode. Records detailed bonding configuration information, including mode, MII status, Actor/Partner information, slave link status, etc. (outputs the complete content of /proc/net/bonding/bondX).
Typical Scenarios Identifies faults on the physical machine or switch side in bonding mode and resolves LACP negotiation jitter issues.
Data Storage Automatically stored in Elasticsearch or as files on the physical machine disk.
Sample Data (the content field contains the full text)
"tracer_data": {
	"content": "/proc/net/bonding/bond0\nEthernet Channel Bonding Driver: v4.18.0...\nBonding Mode: IEEE 802.3ad Dynamic link aggregation\nMII Status: down\n..."
}
Fields
- content: Complete bonding interface status information (multi-line text containing LACP negotiation details for all slaves)
6.3 - Autotracing
Overview
AutoTracing is an intelligent diagnostic feature of the Huatuo kernel monitoring system.
When the system experiences specific performance anomalies or sudden resource spikes, AutoTracing is automatically triggered. It captures detailed on-site information in real time, including flame graphs, process context, call stacks, and resource status. This helps operations and development teams quickly locate and analyze issues without manual intervention.
This feature is built on eBPF technology, offering low overhead and high real-time performance. It is suitable for anomaly diagnosis in both physical machines and container environments.
Supported Types
The current version supports the following five types of automatic tracing:
| Tracing Name | Core Function | Use Cases |
|---|---|---|
| cpusys | Detects sudden increases in physical machine CPU sys (kernel) usage, automatically generates flame graphs and provides process context information | Resolves business jitter and latency issues caused by abnormal system load |
| cpuidle | Detects abnormal decreases in container CPU idle rate, automatically generates flame graphs and provides process context information | Addresses abnormal container CPU usage and helps analyze process hotspots |
| dload | Detects sudden increases in container loadavg, automatically captures call information of D-state processes inside the container | Solves issues caused by sudden spikes in D-state processes, resource unavailability, or long-held locks |
| memburst | Detects sudden memory allocation bursts on physical machines, automatically captures process memory usage status | Handles scenarios with large amounts of memory allocation in a short time, which may trigger direct reclaim or OOM |
| iotracing | Detects abnormal disk IO latency on physical machines, automatically captures related processes, containers, disks, and file information | Resolves application request delays or system performance jitter caused by saturated disk IO bandwidth or sudden increases in disk access |
Features
- Intelligent Triggering: Automatically detects anomalies based on preset thresholds, eliminating the need for manual configuration.
- Rich Diagnostic Information: Automatically collects key data such as flame graphs, call stacks, process/container context, and resource usage details each time it is triggered.
- Low Overhead Design: Uses eBPF technology to perform targeted collection only when anomalies occur, resulting in extremely low overhead during normal operation.
- Unified Output: All tracing data is reported in a standardized format, facilitating querying, analysis, and integration with alerting systems.
Recommendations
- cpusys and cpuidle are ideal for quickly locating CPU-related performance jitter.
- dload is particularly useful for issues caused by “pseudo-dead” or stalled processes due to D-state processes.
- memburst helps detect potential memory pressure in advance and prevents OOM occurrences.
- iotracing is the preferred tool for troubleshooting disk IO bottlenecks.
With the AutoTracing feature, Huatuo enables an automated closed loop from anomaly detection to on-site preservation, significantly improving problem diagnosis efficiency.
6.4 - Hardware Errors
Architecture
The huatuo supports detection of various hardware faults, including:
- CPU, L1/L2/L3 Cache, TLB
- Memory, ECC
- PCIe
- Network Interface Card Link
- PFC / RDMA
- ACPI
- GPU MetaX
Overall Architecture of HUATUO
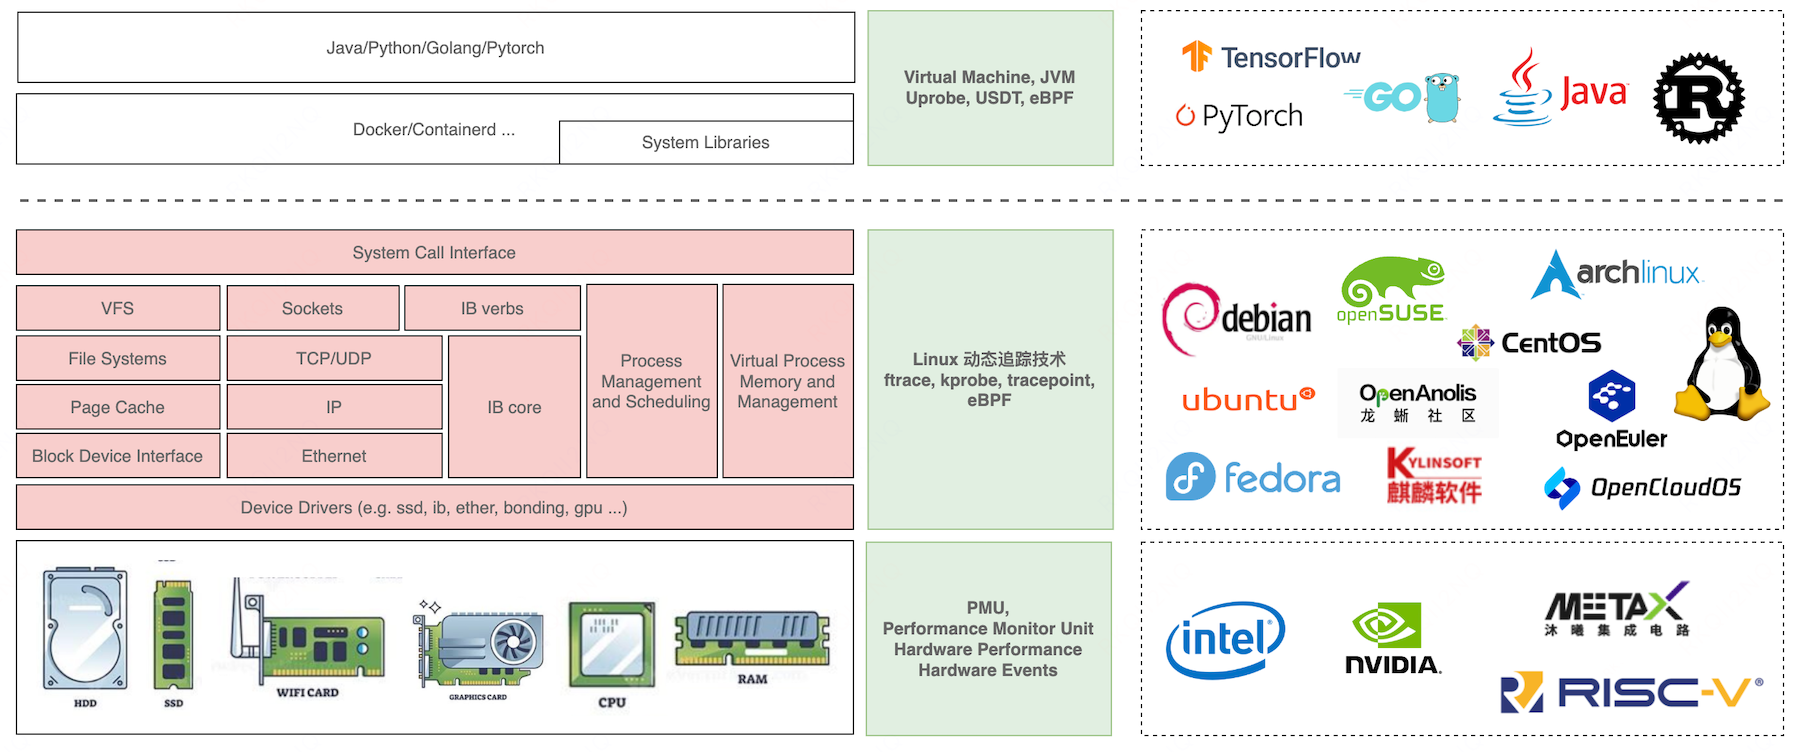
The huatuo is built on Linux kernel MCE (Machine Check Exception) and RAS (Reliability, Availability, and Serviceability) mechanisms. It uses eBPF to capture critical hardware events and retrieve device information. The Linux kernel RAS framework has been continuously evolving since kernel 2.6, gradually adding more tracepoints. This lightweight, event-driven approach covers most high-frequency hardware fault scenarios. In addition, HUATUO supports monitoring of PFC/RDMA congestion as well as physical link status of network interfaces.
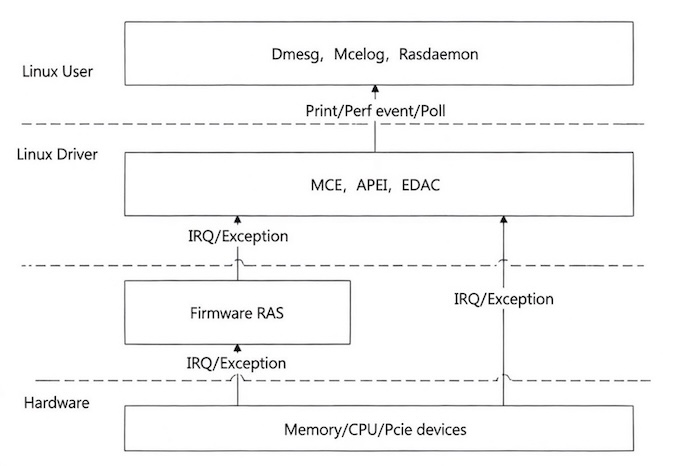
Hardware Event Metrics
The huatuo can capture hardware events through eBPF and obtain key information such as:
- fault type
- device id
- error details
- timestamp
- and other related data
Network Link Faults
Fault information is stored both locally on the server where the HUATUO component is deployed (under huatuo-local/netdev_event) and in the configured Elasticsearch service.
The local file data format:
{
    "hostname": "your-host-name",
    "region": "xxx",
    "uploaded_time": "2026-03-05T18:28:39.153438921+08:00",
    "time": "2026-03-05 18:28:39.153 +0800",
    "tracer_name": "netdev_event",
    "tracer_time": "2026-03-05 18:28:39.153 +0800",
    "tracer_type": "auto",
    "tracer_data": {
        "ifname": "eth0",
        "index": 2,
        "linkstatus": "linkstatus_admindown",
        "mac": "5c:6f:11:11:11:11",
        "start": false
    }
}
linkstatus possible values:
linkstatus_adminup — Administrator enabled the interface (e.g. ip link set dev eth0 up)
linkstatus_admindown — Administrator disabled the interface (e.g. ip link set dev eth0 down)
linkstatus_carrierup — Physical link restored
linkstatus_carrierdown — Physical link failure
NIC Packet Loss
huatuo_bamai_buddyinfo_blocks{host="hostname",region="xxx",device="eth0",driver="ixgbe"} 0
NIC RDMA PFC Congestion
# HELP huatuo_bamai_netdev_dcb_pfc_received_total count of the received pfc frames
# TYPE huatuo_bamai_netdev_dcb_pfc_received_total counter
huatuo_bamai_netdev_dcb_pfc_received_total{device="enp6s0f0np0",host="hostname",prio="0",region="xxx"} 0
huatuo_bamai_netdev_dcb_pfc_received_total{device="enp6s0f0np0",host="hostname",prio="1",region="xxx"} 0
huatuo_bamai_netdev_dcb_pfc_received_total{device="enp6s0f0np0",host="hostname",prio="2",region="xxx"} 0
huatuo_bamai_netdev_dcb_pfc_received_total{device="enp6s0f0np0",host="hostname",prio="3",region="xxx"} 0
huatuo_bamai_netdev_dcb_pfc_received_total{device="enp6s0f0np0",host="hostname",prio="4",region="xxx"} 0
huatuo_bamai_netdev_dcb_pfc_received_total{device="enp6s0f0np0",host="hostname",prio="5",region="xxx"} 0
huatuo_bamai_netdev_dcb_pfc_received_total{device="enp6s0f0np0",host="hostname",prio="6",region="xxx"} 0
huatuo_bamai_netdev_dcb_pfc_received_total{device="enp6s0f0np0",host="hostname",prio="7",region="xxx"} 0
# HELP huatuo_bamai_netdev_dcb_pfc_send_total count of the sent pfc frames
# TYPE huatuo_bamai_netdev_dcb_pfc_send_total counter
huatuo_bamai_netdev_dcb_pfc_send_total{device="enp6s0f0np0",host="hostname",prio="0",region="xxx"} 0
huatuo_bamai_netdev_dcb_pfc_send_total{device="enp6s0f0np0",host="hostname",prio="1",region="xxx"} 0
huatuo_bamai_netdev_dcb_pfc_send_total{device="enp6s0f0np0",host="hostname",prio="2",region="xxx"} 0
huatuo_bamai_netdev_dcb_pfc_send_total{device="enp6s0f0np0",host="hostname",prio="3",region="xxx"} 0
huatuo_bamai_netdev_dcb_pfc_send_total{device="enp6s0f0np0",host="hostname",prio="4",region="xxx"} 0
huatuo_bamai_netdev_dcb_pfc_send_total{device="enp6s0f0np0",host="hostname",prio="5",region="xxx"} 0
huatuo_bamai_netdev_dcb_pfc_send_total{device="enp6s0f0np0",host="hostname",prio="6",region="xxx"} 0
huatuo_bamai_netdev_dcb_pfc_send_total{device="enp6s0f0np0",host="hostname",prio="7",region="xxx"} 0
RAS Hardware Faults
huatuo_bamai_ras_hw_total{host="hostname",region="xxx"} 0
{
    "hostname": "your-host-name",
    "region": "nmg02",
    "uploaded_time": "2026-03-01T15:41:13.027353585+08:00",
    "time": "2026-03-01 15:41:13.027 +0800",
    "tracer_name": "ras",
    "tracer_time": "2026-03-01 15:41:13.027 +0800",
    "tracer_type": "auto",
    "tracer_data": {
        "dev": "MEM",
        "event": "EDAC",
        "type": "CORRECTED",
        "timestamp": 26870134986481080,
        "info": "1 CORRECTED err: memory read error on CPU_SrcID#0_MC#1_Chan#0_DIMM#0 (mc: 1 location:0:0:-1 address: 0x3ddc84140 grain:32 syndrome:0x0  err_code:0x0101:0x0090 ProcessorSocketId:0x0 MemoryControllerId:0x1 PhysicalRankId:0x0 Row:0x15da Column:0x100 Bank:0x3 BankGroup:0x1 retry_rd_err_log[0001a209 00000000 00800000 0440d001 000015da] correrrcnt[0001 0000 0000 0000 0000 0000 0000 0000])"
    }
}
7 - Best Practice
8 - Development
8.1 - Collection Framework
HuaTuo framework provides three data collection modes: autotracing, event, and metrics, covering different monitoring scenarios, helping users gain comprehensive insights into system performance.
Collection Mode Comparison
| Mode | Type | Trigger Condition | Data Output | Use Case |
|---|---|---|---|---|
| Autotracing | Event-driven | Triggered on system anomalies | ES + Local Storage, Prometheus (optional) | Non-routine operations, triggered on anomalies |
| Event | Event-driven | Continuously running, triggered on preset thresholds | ES + Local Storage, Prometheus (optional) | Continuous operations, directly dump context |
| Metrics | Metric collection | Passive collection | Prometheus format | Monitoring system metrics |
Autotracing
- Type: Event-driven (tracing).
- Function: Automatically tracks system anomalies and dump context when anomalies occur.
- Features:
- When a system anomaly occurs,
autotracingis triggered automatically to dump relevant context. - Data is stored to ES in real-time and stored locally for subsequent analysis and troubleshooting. It can also be monitored in Prometheus format for statistics and alerts.
- Suitable for scenarios with high performance overhead, such as triggering captures when metrics exceed a threshold or rise too quickly.
- When a system anomaly occurs,
- Integrated Features: CPU anomaly tracking (cpu idle), D-state tracking (dload), container contention (waitrate), memory burst allocation (memburst), disk anomaly tracking (iotracer).
Event
- Type: Event-driven (tracing).
- Function: Continuously operates within the system context, directly dump context when preset thresholds are met.
- Features:
- Unlike
autotracing,eventcontinuously operates within the system context, rather than being triggered by anomalies. - Data is also stored to ES and locally, and can be monitored in Prometheus format.
- Suitable for continuous monitoring and real-time analysis, enabling timely detection of abnormal behaviors. The performance impact of
eventcollection is negligible.
- Unlike
- Integrated Features: Soft interrupt anomalies (softirq), memory allocation anomalies (oom), soft lockups (softlockup), D-state processes (hungtask), memory reclamation (memreclaim), packet droped abnormal (dropwatch), network ingress latency (net_rx_latency).
Metrics
- Type: Metric collection.
- Function: Collects performance metrics from subsystems.
- Features:
- Metric data can be sourced from regular procfs collection or derived from
tracing(autotracing, event) data. - Outputs in Prometheus format for easy integration into Prometheus monitoring systems.
- Unlike
tracingdata,metricsprimarily focus on system performance metrics such as CPU usage, memory usage, and network traffic, etc. - Suitable for monitoring system performance metrics, supporting real-time analysis and long-term trend observation.
- Metric data can be sourced from regular procfs collection or derived from
- Integrated Features: CPU (sys, usr, util, load, nr_running, etc.), memory (vmstat, memory_stat, directreclaim, asyncreclaim, etc.), IO (d2c, q2c, freeze, flush, etc.), network (arp, socket mem, qdisc, netstat, netdev, sockstat, etc.).
Multiple Purpose of Tracing Mode
Both autotracing and event belong to the tracing collection mode, offering the following dual purposes:
- Real-time storage to ES and local storage: For tracing and analyzing anomalies, helping users quickly identify root causes.
- Output in Prometheus format: As metric data integrated into Prometheus monitoring systems, providing comprehensive system monitoring capabilities.
By flexibly combining these three modes, users can comprehensively monitor system performance, capturing both contextual information during anomalies and continuous performance metrics to meet various monitoring needs.
8.2 - Add Metrics
Overview
The Metrics type is used to collect system performance and other indicator data. It can output in Prometheus format, serving as a data provider through the /metrics (curl localhost:<port>/metrics) .
-
Type:Metrics collection
-
Function:Collects performance metrics from various subsystems
-
Characteristics:
- Metrics are primarily used to collect system performance metrics such as CPU usage, memory usage, network statistics, etc. They are suitable for monitoring system performance and support real-time analysis and long-term trend observation.
- Metrics can come from regular procfs/sysfs collection or be generated from tracing types (autotracing, event).
- Outputs in Prometheus format for seamless integration into the Prometheus observability ecosystem.
-
Already Integrated:
- cpu (sys, usr, util, load, nr_running…)
- memory(vmstat, memory_stat, directreclaim, asyncreclaim…)
- IO (d2c, q2c, freeze, flush…)
- Network(arp, socket mem, qdisc, netstat, netdev, socketstat…)
How to Add Statistical Metrics
Simply implement the Collector interface and complete registration to add metrics to the system.
type Collector interface {
    // Get new metrics and expose them via prometheus registry.
    Update() ([]*Data, error)
}
1. Create a Structure
Create a structure that implements the Collector interface in the core/metrics directory:
type exampleMetric struct{
}
2. Register Callback Function
func init() {
    tracing.RegisterEventTracing("example", newExample)
}

func newExample() (*tracing.EventTracingAttr, error) {
    return &tracing.EventTracingAttr{
        TracingData: &exampleMetric{},
        Flag: tracing.FlagMetric, // Mark as Metric type
    }, nil
}
3. Implement the Update Method
func (c *exampleMetric) Update() ([]*metric.Data, error) {
    // do something
    ...
	return []*metric.Data{
		metric.NewGaugeData("example", value, "description of example", nil),
	}, nil

}
The core/metrics directory in the project has integrated various practical Metrics examples, along with rich underlying interfaces provided by the framework, including BPF program and map data interaction, container information, etc. For more details, refer to the corresponding code implementations.
8.3 - Add Event
Overview
- Type: Exception event-driven(tracing/event)
- Function:Continuously runs in the system and captures context information when preset thresholds are reached
- Characteristics:
- Unlike
autotracing,eventruns continuously rather than being triggered only when exceptions occur. - Event data is stored locally in real-time and also sent to remote ES. You can also generate Prometheus metrics for observation.
- Suitable for continuous monitoring and real-time analysis, enabling timely detection of abnormal behaviors in the system. The performance impact of
eventtype collection is negligible.
- Unlike
- Already Integrated: Soft interrupt abnormalities(softirq)、abnormal memory allocation(oom)、soft lockups(softlockup)、D-state processes(hungtask)、memory reclaim(memreclaim)、abnormal packet loss(dropwatch)、network inbound latency (net_rx_latency), etc.
How to Add Event Metrics
Simply implement the ITracingEvent interface and complete registration to add events to the system.
There is no implementation difference between
AutoTracingandEventin the framework; they are only differentiated based on practical application scenarios.
// ITracingEvent represents a tracing/event
type ITracingEvent interface {
    Start(ctx context.Context) error
}
1. Create Event Structure
type exampleTracing struct{}
2. Register Callback Function
func init() {
    tracing.RegisterEventTracing("example", newExample)
}

func newExample() (*tracing.EventTracingAttr, error) {
    return &tracing.EventTracingAttr{
        TracingData: &exampleTracing{},
        Internal:    10, // Interval in seconds before re-enabling tracing
        Flag:        tracing.FlagTracing, // Mark as tracing type; | tracing.FlagMetric (optional)
    }, nil
}
3. Implement the ITracingEvent Interface
func (t *exampleTracing) Start(ctx context.Context) error {
    // do something
    ...

    // Store data to ES and locally
    storage.Save("example", ccontainerID, time.Now(), tracerData)
}
Additionally, you can optionally implement the Collector interface to output in Prometheus format:
func (c *exampleTracing) Update() ([]*metric.Data, error) {
    // from tracerData to prometheus.Metric
    ...

    return data, nil
}
The core/events directory in the project has integrated various practical events examples, along with rich underlying interfaces provided by the framework, including BPF program and map data interaction, container information, etc. For more details, refer to the corresponding code implementations.
8.4 - Add Autotracing
Overview
- Type:Exception event-driven(tracing/autotracing)
- Function:Automatically tracks system abnormal states and triggers context information capture when exceptions occur
- Characteristics:
- When system abnormalities occur,
autotracingautomatically triggers and captures relevant context information - Event data is stored locally in real-time and also sent to remote ES, while you can also generate Prometheus metrics for observation
- Suitable for significant performance overhead, such as triggering capture when detecting metrics rising above certain thresholds or rising too rapidly
- When system abnormalities occur,
- Already Integrated:abnormal usage tracking (cpu idle), D-state tracking (dload), container internal/external contention (waitrate), sudden memory allocation (memburst), disk abnormal tracking (iotracer)
How to Add Autotracing
AutoTracing only requires implementing the ITracingEvent interface and completing registration to add events to the system.
There is no implementation difference between
AutoTracingandEventin the framework; they are only differentiated based on practical application scenarios.
// ITracingEvent represents a autotracing or event
type ITracingEvent interface {
    Start(ctx context.Context) error
}
1. Create Structure
type exampleTracing struct{}
2. Register Callback Function
func init() {
    tracing.RegisterEventTracing("example", newExample)
}

func newExample() (*tracing.EventTracingAttr, error) {
    return &tracing.EventTracingAttr{
        TracingData: &exampleTracing{},
        Internal:    10, // Interval in seconds before re-enabling tracing
        Flag:        tracing.FlagTracing, // Mark as tracing type; | tracing.FlagMetric (optional)
    }, nil
}
3. Implement ITracingEvent
func (t *exampleTracing) Start(ctx context.Context) error {
    // detect your care about
    ...

    // Store data to ES and locally
    storage.Save("example", ccontainerID, time.Now(), tracerData)
}
Additionally, you can optionally implement the Collector interface to output in Prometheus format:
func (c *exampleTracing) Update() ([]*metric.Data, error) {
    // from tracerData to prometheus.Metric
    ...

    return data, nil
}
The core/autotracing directory in the project has integrated various practical autotracing 示examples, along with rich underlying interfaces provided by the framework, including BPF program and map data interaction, container information, etc. For more details, refer to the corresponding code implementations.
9 - Frequenty Asked Questions
10 - Contribute
11 - Change Log
Features
- Added iotracing AutoTracing capability
- Added general hardware failure detection (CPU, Memory, PCIe)
- Added MetaX GPU failure detection
- Added physical link detection support
- Added support for Amazon EKS deployment
- Added support for Aliyun ACK deployment
- Added dropwatch namespace cookie support
- Added container throttled_time metric
- Added compatibility with kubelet systemd cgroup driver
- Added automatic detection of kubelet cgroup driver type
- Added, optimized, and standardized the huatuo-bamai configuration file
- Added Github CI/CD automated testing
- Added unit testing, integration testing, and end-to-end testing
- Enhanced golangci-lint static code analysis rules
- Added daemonset YAML deployment files
- Added new Metric API interfaces
- Added compatibility support for 5.15.x kernel series
Bug Fixes & Improvements
- Optimized local storage format
- Optimized and refactored code in multiple modules
- Improved and enriched documentation at https://huatuo.tech/docs/