Getting started
To help users quickly experience and deploy HUATUO, this document is divided into three sections: Quick Experience,Quick Start,Compilation & Deployment.
1 Quick Experience
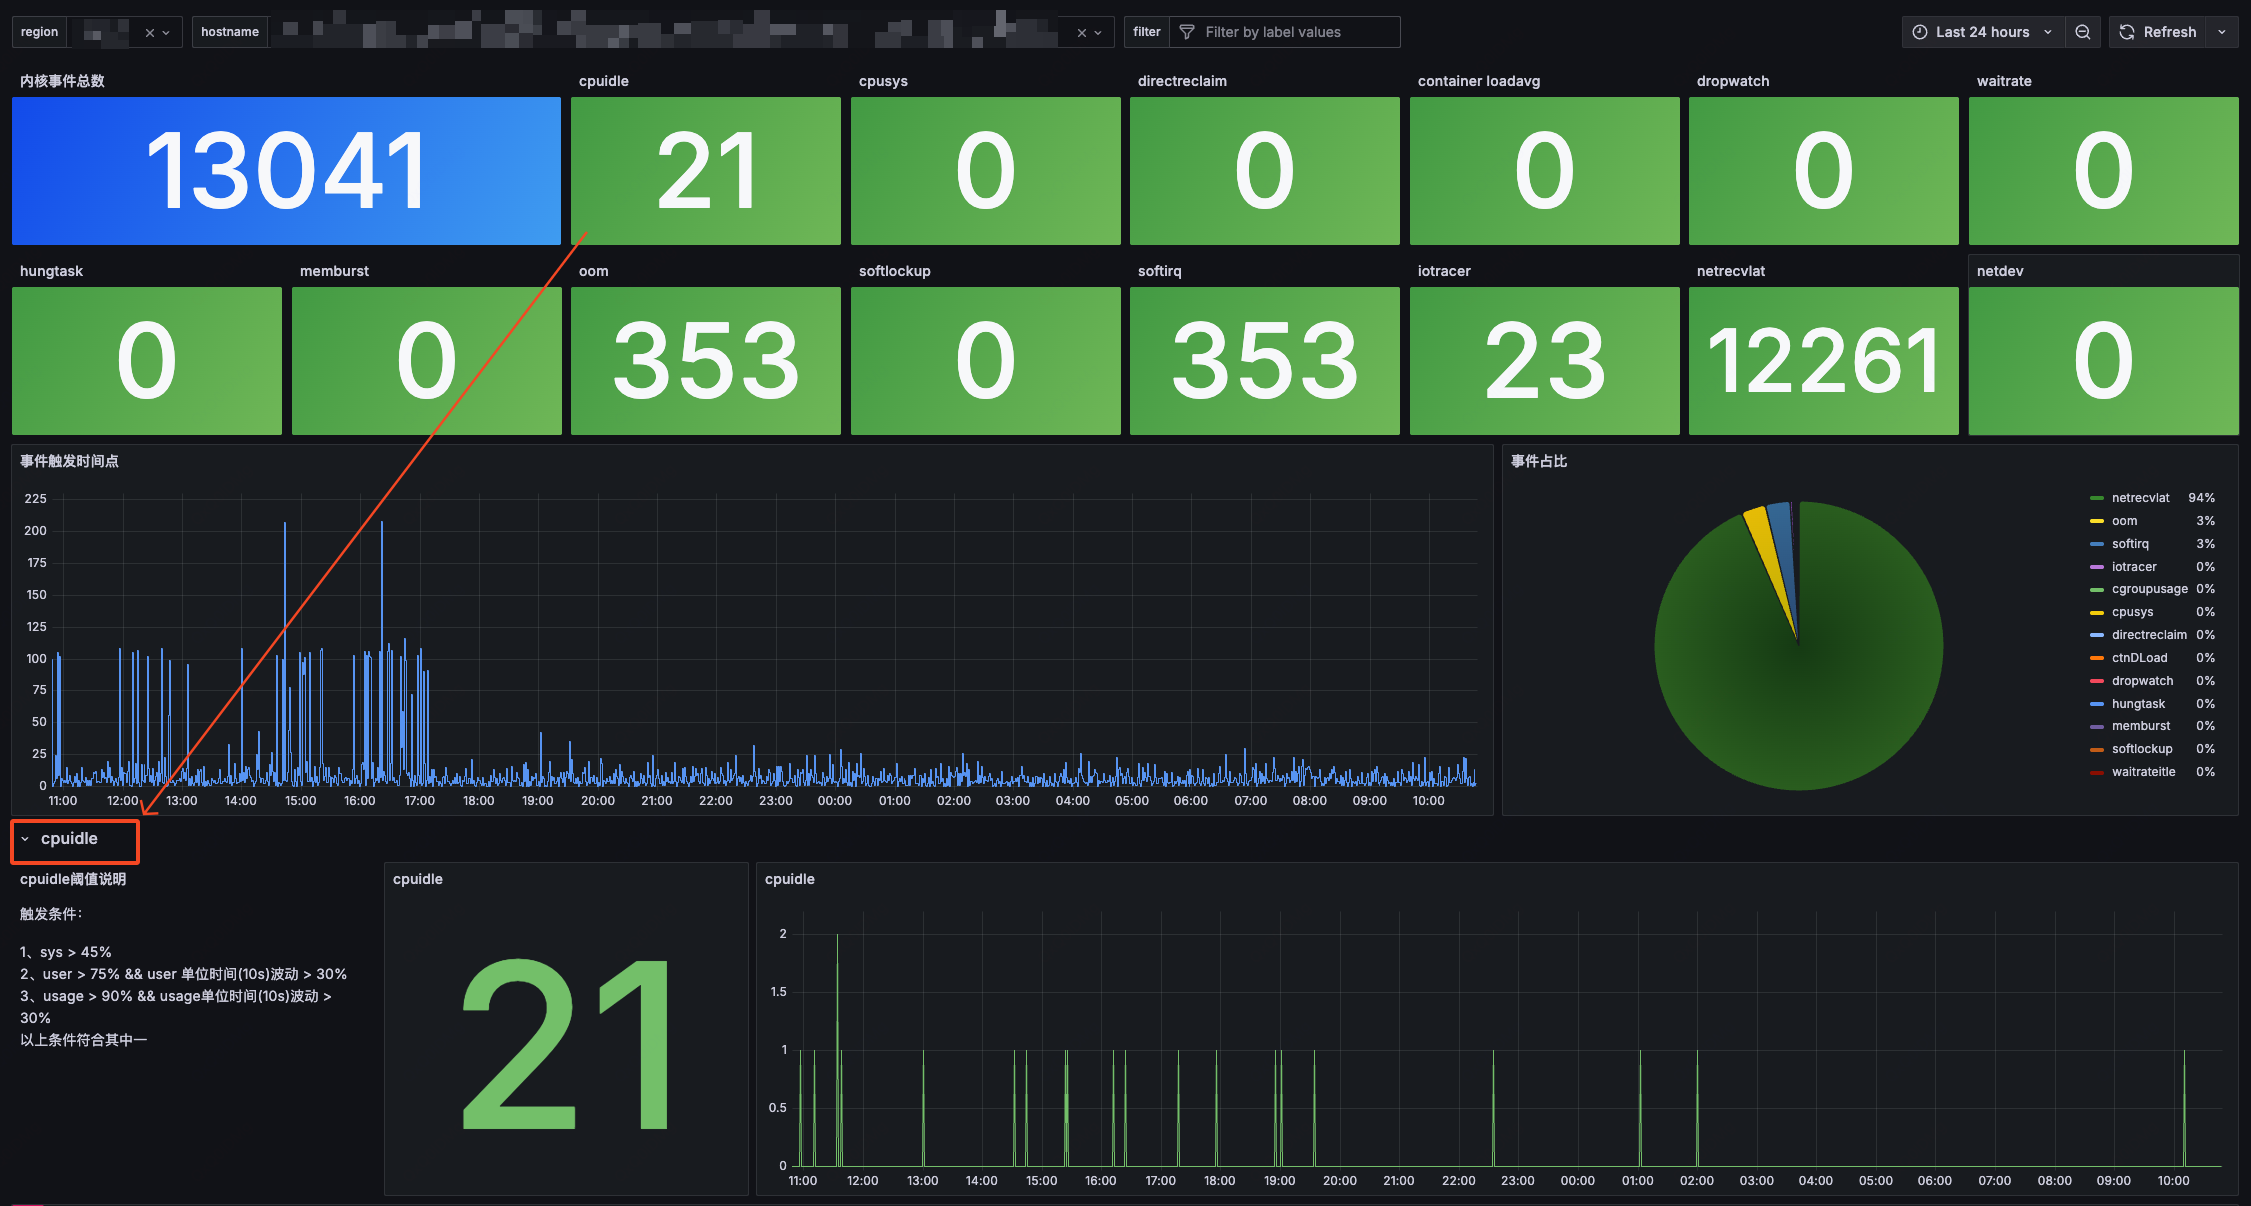
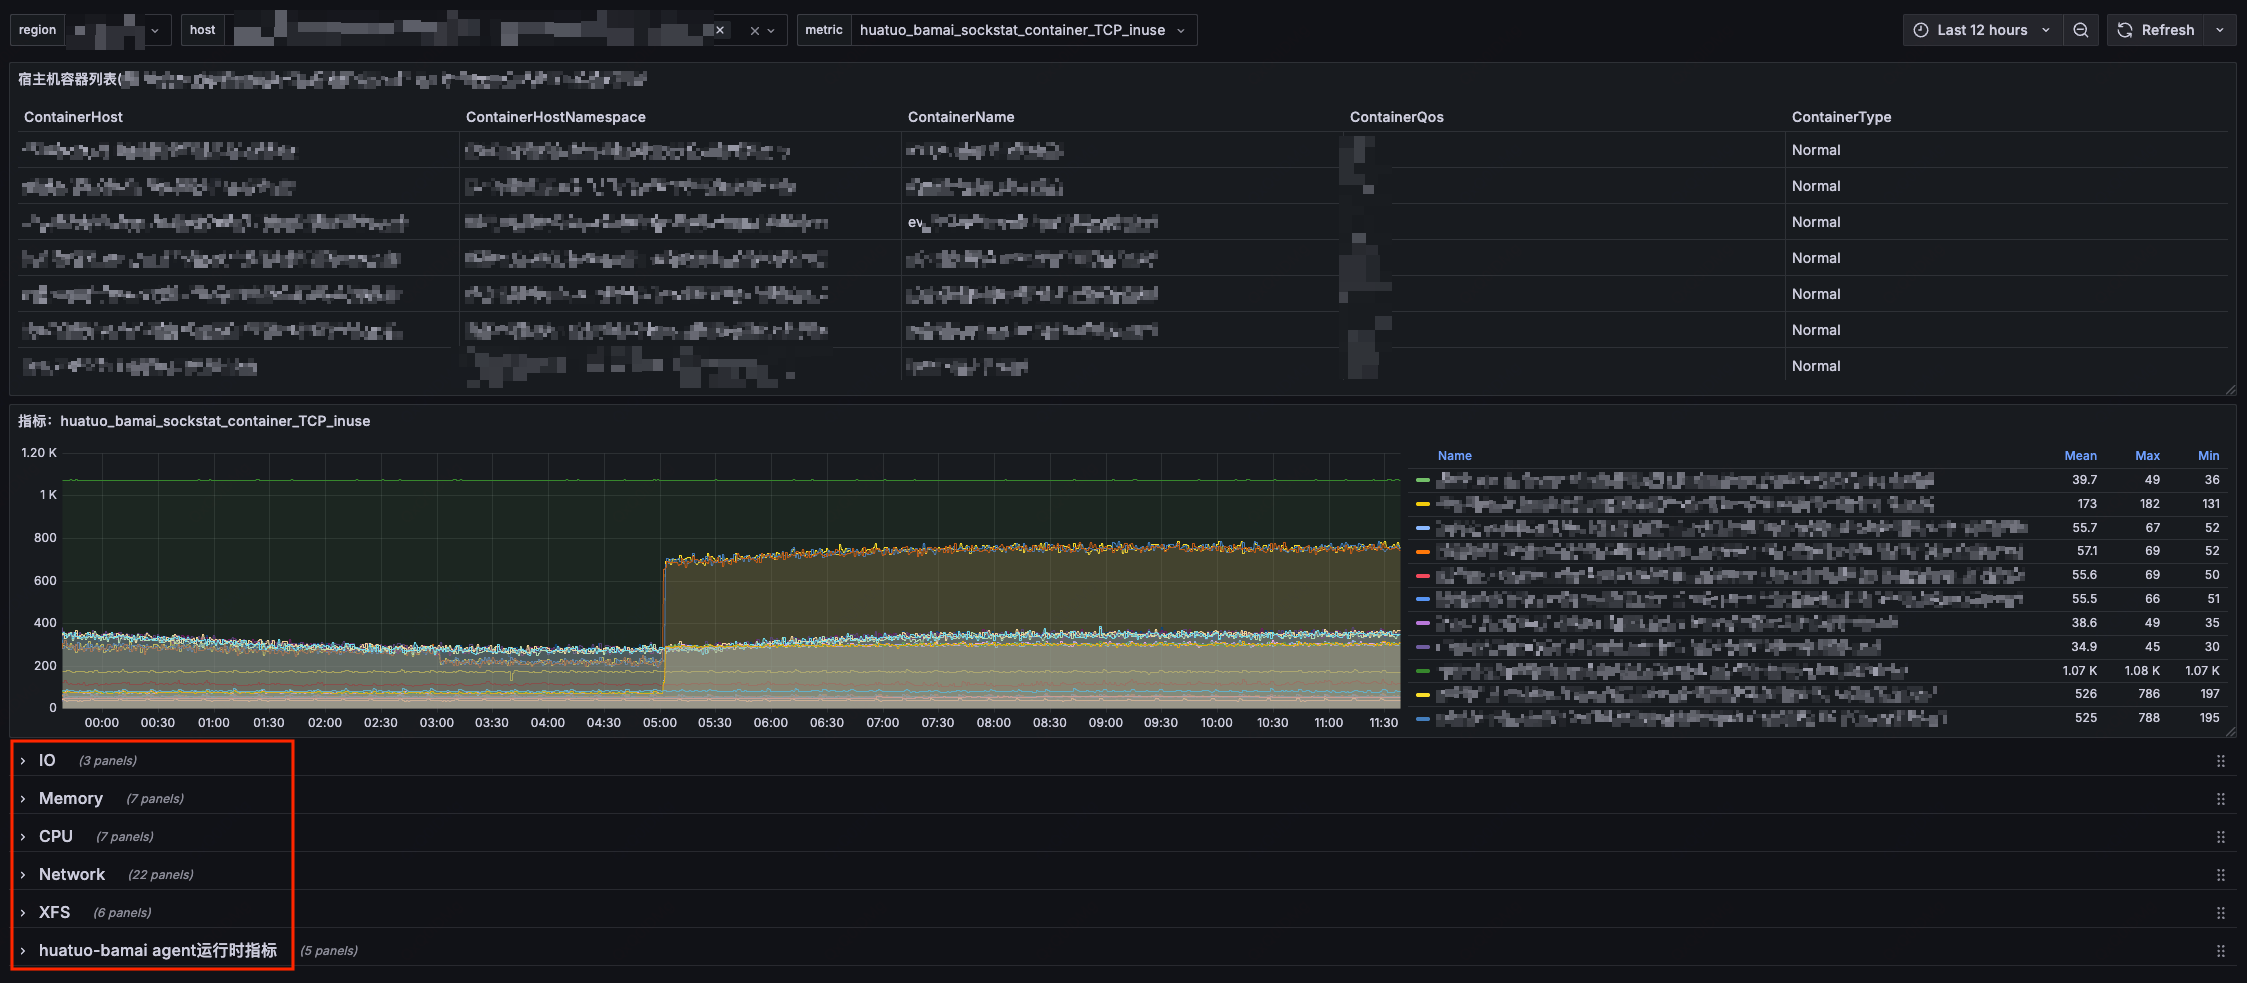
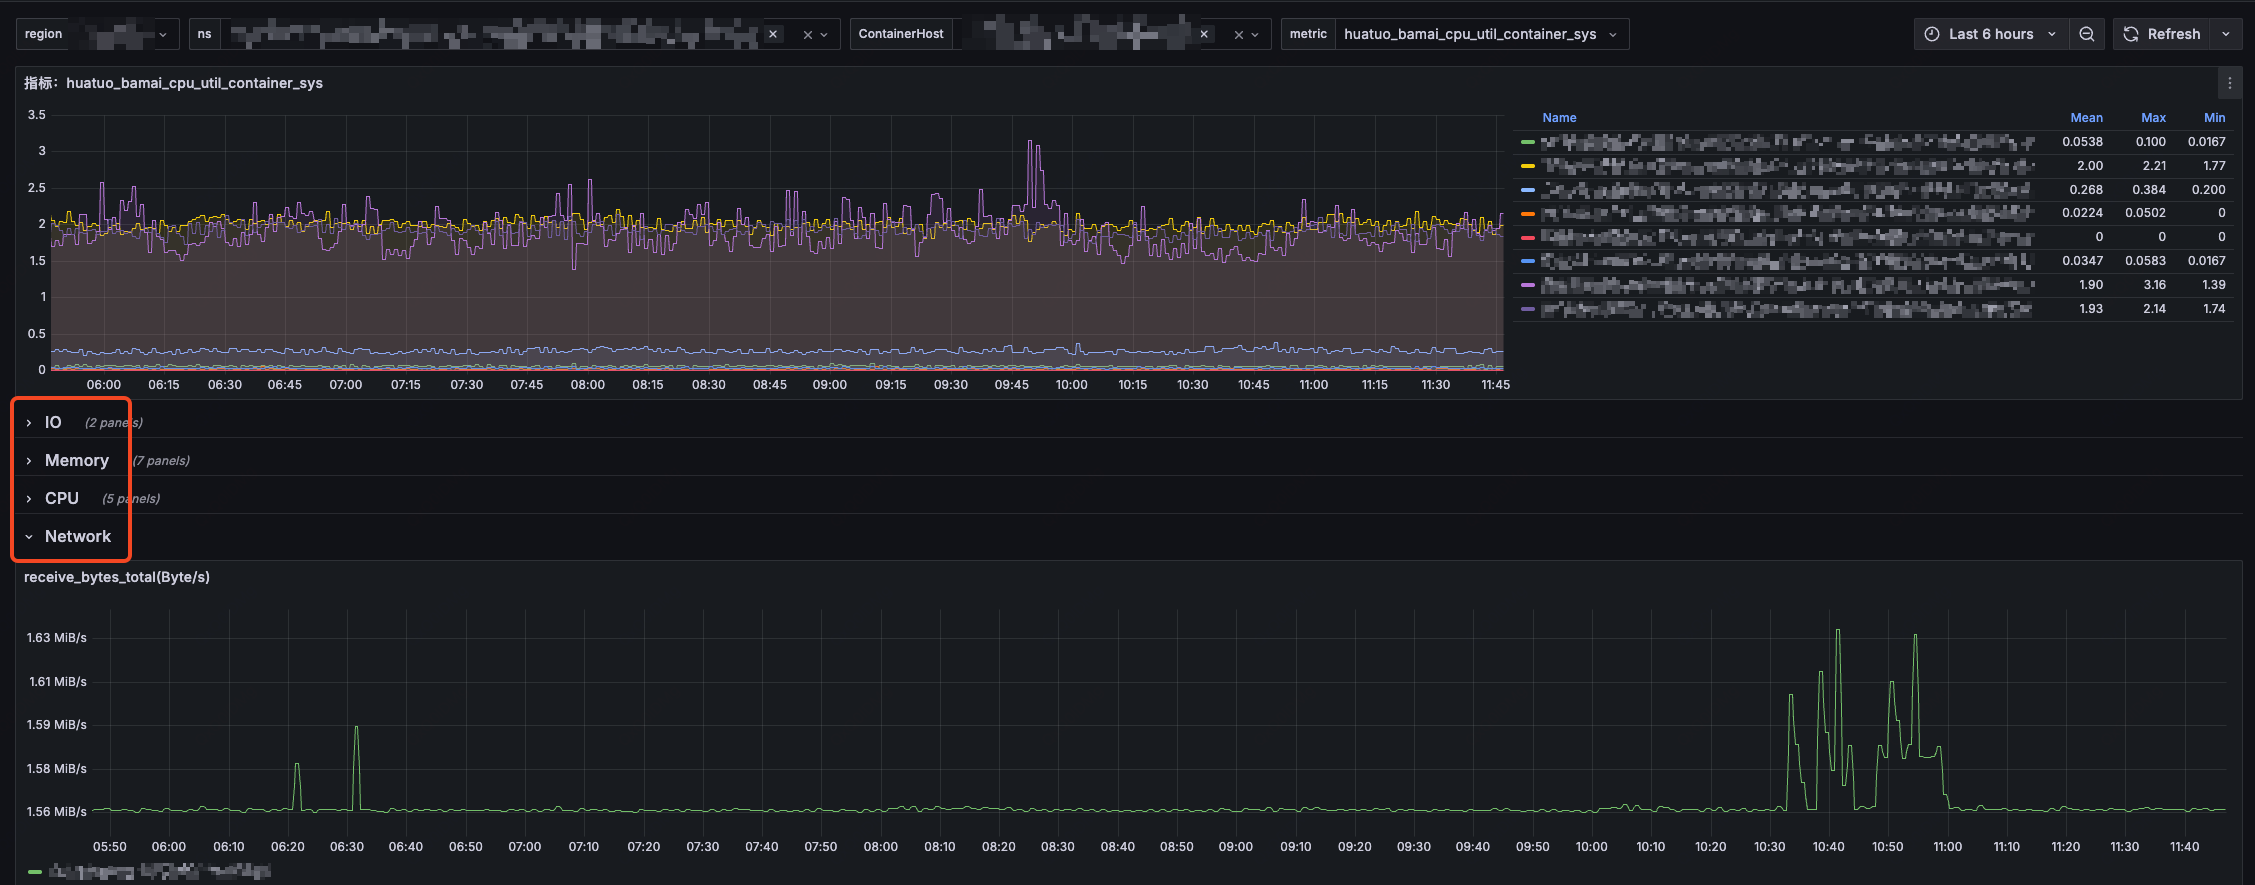
This section helps you quickly explore the frontend capabilities. You can directly perform various query operations on the frontend dashboard, such as viewing exception event overviews, exception event context information, metric curves, etc. Access the dashboard example without login:
-
Events, AutoTracing Dashboard(improvements in progress)
 In the example, jumping to the flame graph page requires login. Account: huatuo Password: huatuo1024
2 Quick Start
2.1 Quick Run
If you want to understand the underlying principles and deploy HUATUO to your own monitoring system, you can start pre-compiled container images via Docker (Note: This method disables container information retrieval and ES storage functionality by default).
-
Direct Execution:
$ docker run --privileged --cgroupns=host --network=host -v /sys:/sys -v /proc:/proc -v /run:/run huatuo/huatuo-bamai:latest -
Metric Collection:In another terminal, collect metrics
$ curl -s localhost:19704/metrics -
View Exception Events (Events, AutoTracing):HUATUO stores collected kernel exception event information in ES (disabled by default) while retaining a copy in the local directory
huatuo-local. Note: Typically, no files exist in this path (systems in normal state don’t trigger event collection). You can generate events by creating exception scenarios or modifying configuration thresholds.
2.2 Quick Setup
If you want to further understand HUATUO’s operational mechanisms, architecture design, monitoring dashboard, and custom deployment, you can quickly set up a complete local environment using docker compose.
$ docker compose --project-directory ./build/docker up
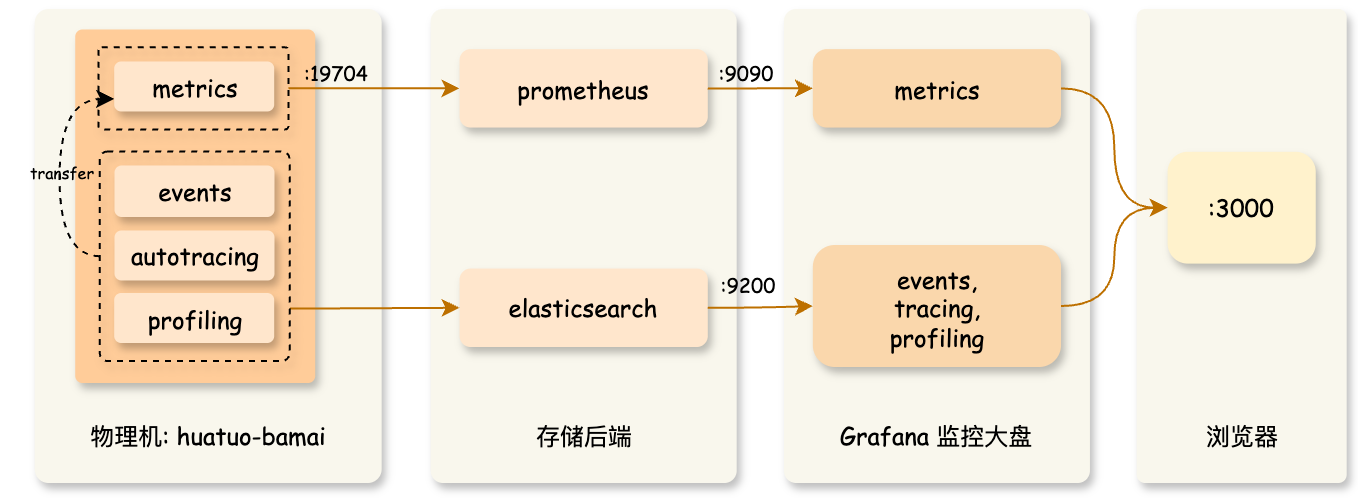
This command pulls the latest images and starts components including elasticsearch, prometheus, grafana,huatuo-bamai. After successful command execution, open your browser and visit http://localhost:3000 to access the monitoring dashboard (Grafana default admin account: admin, password: admin; Since your system is in normal state, the Events and AutoTracing dashboards typically won’t display data).
3 Compilation & Deployment
3.1 Compilation
To isolate the developer’s local environment and simplify the compilation process, we provide containerized compilation. You can directly use docker build to construct the completed image (including the underlying collector huatuo-bamai, BPF objects, tools, etc.). Run the following command in the project root directory:
$ docker build --network host -t huatuo/huatuo-bamai:latest .
3.2 Execution
-
Run container:
$ docker run --privileged --cgroupns=host --network=host -v /sys:/sys -v /proc:/proc -v /run:/run huatuo/huatuo-bamai:latest -
Or copy all files from the container path
/home/huatuo-bamaiand run manually locally:$ ./huatuo-bamai --region example --config huatuo-bamai.conf -
Management: Can be managed using systemd/supervisord/k8s-DaemonSet, etc.
3.3 Configuration
-
Container Information Configuration
HUATUO obtains POD/container information by calling the kubelet interface. Configure the access interface and certificates according to your actual environment. Empty configuration "" indicates disabling this functionality.
[Pod] KubeletPodListURL = "http://127.0.0.1:10255/pods" KubeletPodListHTTPSURL = "https://127.0.0.1:10250/pods" KubeletPodClientCertPath = "/var/lib/kubelet/pki/kubelet-client-current.pem" -
Storage Configuration
-
Metric Storage (Metric): All metrics are stored in Prometheus. You can access the :19704/metrics interface to obtain metrics.
-
Exception Event Storage (Events, AutoTracing): All kernel events and AutoTracing events are stored in ES. Note: If the configuration is empty, ES storage is not activated, and events are only stored in the local directory
huatuo-local.ES storage configuration is as follows:
[Storage.ES]
    Address = "http://127.0.0.1:9200"
    Username = "elastic"
    Password = "huatuo-bamai"
    Index = "huatuo_bamai"
Local storage configuration is as follows:
# tracer's record data
# Path: all but the last element of path for per tracer
# RotationSize: the maximum size in Megabytes of a record file before it gets rotated for per subsystem
# MaxRotation: the maximum number of old log files to retain for per subsystem
[Storage.LocalFile]
    Path = "huatuo-local"
    RotationSize = 100
    MaxRotation = 10
-
-
Event Thresholds
All kernel event collections (Events and AutoTracing) can have configurable trigger thresholds. The default thresholds are empirical data repeatedly validated in actual production environments. You can modify thresholds in huatuo-bamai.conf according to your requirements.
-
Resource Limits
To ensure host machine stability, we have implemented resource limits for the collector. LimitInitCPU represents CPU resources occupied during collector startup, while LimitCPU/LimitMem represent resource limits for normal operation after successful startup:
[RuntimeCgroup]
    LimitInitCPU = 0.5
    LimitCPU = 2.0
    # limit memory (MB)
    LimitMem = 2048
Feedback
Was this page helpful?
Glad to hear it! Please tell us how we can improve.
Sorry to hear that. Please tell us how we can improve.